## Diagram: Scene Graph Representation with Cyclic Shifts
### Overview
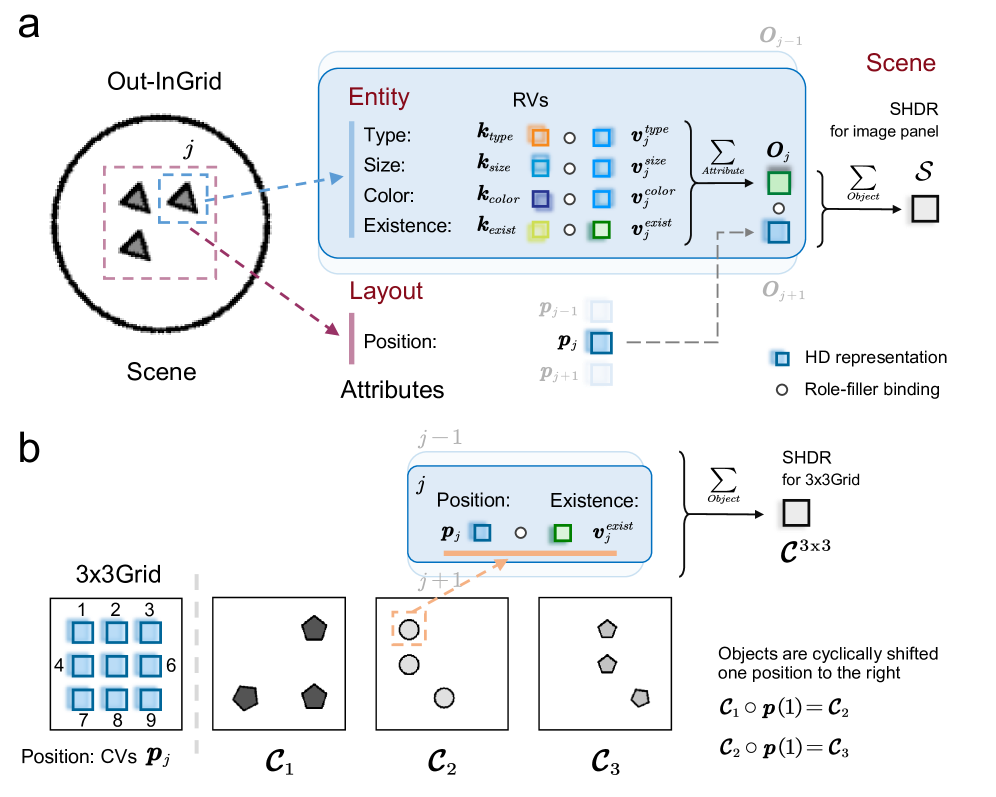
The image presents a diagram illustrating a scene graph representation method, specifically focusing on out-in grid structures and cyclic shifts within a 3x3 grid. It details how entities within a scene are represented using RVs (Role Variables) and how their attributes (type, size, color, existence) are encoded. The diagram is split into two parts, labeled 'a' and 'b', demonstrating the process for both a general Out-In Grid and a specific 3x3 Grid example.
### Components/Axes
**Part a:**
* **Out-In Grid:** A circular representation of a scene containing several polygonal shapes (triangle, hexagon, pentagon, square).
* **Entity:** Lists attributes: Type, Size, Color, Existence.
* **RVs:** Role Variables associated with each attribute: *k*<sub>type</sub>, *k*<sub>size</sub>, *k*<sub>color</sub>, *k*<sub>exist</sub> and their corresponding values *v*<sub>type</sub><sup>j</sup>, *v*<sub>size</sub><sup>j</sup>, *v*<sub>color</sub><sup>j</sup>, *v*<sub>exist</sub><sup>j</sup>.
* **Layout:** Position represented by *p*<sub>j</sub>.
* **Attributes:** Position and its corresponding variable *p*<sub>j</sub>.
* **SHDR:** Scene Hierarchy Data Representation, depicted as a flow diagram with summation symbols (Σ) and object representations.
* **Scene:** Label indicating the overall context.
**Part b:**
* **3x3 Grid:** A grid divided into 9 cells, numbered 1 to 9.
* **Position: CVs *p*<sub>j</sub>:** Indicates the position within the grid.
* **C<sub>1</sub>, C<sub>2</sub>, C<sub>3</sub>:** Representations of the grid with different object arrangements.
* **SHDR for 3x3 Grid:** Similar to part a, showing the data representation flow.
* **Objects are cyclically shifted one position to the right:** A textual description of the operation performed on the grid.
* **C<sub>1</sub> ◦ *p*(1) = C<sub>2</sub>** and **C<sub>2</sub> ◦ *p*(1) = C<sub>3</sub>**: Equations describing the cyclic shift operation.
**Legend:**
* **HD representation:** Represented by a solid blue rectangle.
* **Role-filler binding:** Represented by a white circle with a black outline.
### Detailed Analysis or Content Details
**Part a:**
The Out-In Grid shows a scene with four objects. The RVs represent the attributes of these objects. The SHDR flow diagram shows how the attributes are summed (Σ Attribute) to create an object representation (O<sub>j</sub>), which is then summed again (Σ Object) to represent the entire scene (S). The diagram indicates a sequence of scenes O<sub>j-1</sub> -> O<sub>j</sub> -> O<sub>j+1</sub>.
**Part b:**
The 3x3 Grid shows three configurations (C<sub>1</sub>, C<sub>2</sub>, C<sub>3</sub>). C<sub>1</sub> has a hexagon in cell 1, a square in cell 2, a pentagon in cell 3, a blue square in cell 4, a blue rectangle in cell 5, a blue triangle in cell 6, a rectangle in cell 7, a triangle in cell 8, and a pentagon in cell 9. C<sub>2</sub> shows the same shapes cyclically shifted one position to the right. C<sub>3</sub> shows the same shapes cyclically shifted again. The equations demonstrate that applying the position shift *p*(1) to C<sub>1</sub> results in C<sub>2</sub>, and applying it to C<sub>2</sub> results in C<sub>3</sub>.
### Key Observations
* The diagram illustrates a method for representing scenes as graphs, where objects are nodes and their attributes are edges.
* The use of RVs allows for a flexible and structured representation of object attributes.
* The cyclic shift operation demonstrates a way to generate different scene configurations from a base configuration.
* The SHDR flow diagram shows how the attributes are aggregated to represent the scene.
* The legend clearly distinguishes between HD representation and Role-filler binding.
### Interpretation
The diagram presents a novel approach to scene representation that combines graph-based modeling with cyclic shift operations. This method could be useful for tasks such as scene understanding, object recognition, and scene generation. The use of RVs allows for a compact and efficient representation of scene attributes, while the cyclic shift operation provides a way to explore different scene configurations. The SHDR flow diagram provides a clear and concise way to visualize the data representation process. The diagram suggests a system where scenes are not static but can be dynamically altered through cyclic permutations of object positions, potentially enabling the creation of variations or animations. The equations formalize this process, indicating a mathematical foundation for the scene manipulation. The overall goal appears to be to create a structured and computationally tractable representation of visual scenes.