## Diagram: Cyclic Relationship Diagram
### Overview
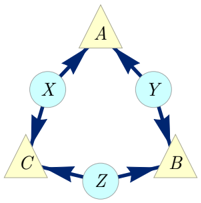
This image depicts a cyclic relationship diagram illustrating the flow of influence or interaction between three triangular nodes labeled A, B, and C, and three circular nodes labeled X, Y, and Z. The arrows indicate the direction of these relationships.
### Components/Axes
* **Triangular Nodes:**
* A (top vertex)
* B (right vertex)
* C (left vertex)
These nodes are colored a pale yellow.
* **Circular Nodes:**
* X (positioned between A and C)
* Y (positioned between A and B)
* Z (positioned between B and C)
These nodes are colored a pale blue.
* **Arrows:** Dark blue arrows indicate the direction of flow or influence.
### Detailed Analysis or Content Details
The diagram shows the following directed relationships:
* An arrow originates from X and points towards A.
* An arrow originates from Y and points towards B.
* An arrow originates from Z and points towards C.
* An arrow originates from A and points towards Y.
* An arrow originates from B and points towards Z.
* An arrow originates from C and points towards X.
This forms a closed loop where each triangular node receives input from a circular node and provides output to another circular node, which in turn influences the next triangular node.
### Key Observations
The diagram represents a cyclical system with three distinct feedback loops. Each component (A, B, C, X, Y, Z) is interconnected in a sequential manner.
### Interpretation
This diagram illustrates a system where elements are in a continuous cycle of influence. The triangular nodes (A, B, C) appear to be distinct entities or states, while the circular nodes (X, Y, Z) might represent intermediate processes, inputs, or mediating factors.
The flow suggests a dynamic where:
* X influences A, which then influences Y.
* Y influences B, which then influences Z.
* Z influences C, which then influences X.
This could represent various phenomena, such as:
* **Ecological Systems:** Predator-prey relationships or nutrient cycles.
* **Economic Models:** Supply and demand chains or market dynamics.
* **Biological Processes:** Hormonal feedback loops or metabolic pathways.
* **Software/System Design:** State transitions or data flow.
The cyclical nature implies a self-sustaining or self-regulating mechanism. Without further context, it's impossible to determine the exact nature of the entities A, B, C, X, Y, and Z, or the specific meaning of the arrows (e.g., increase, decrease, transformation, communication). However, the structure clearly defines a closed-loop system with a defined direction of interaction.