\n
## Diagram: Cyclic Relationship
### Overview
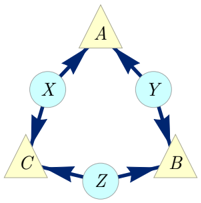
The image depicts a cyclic diagram illustrating relationships between six elements: A, B, C, X, Y, and Z. These elements are arranged in a circular pattern with directional arrows indicating a flow or dependency between them. The diagram does not contain numerical data or scales, but rather focuses on the connections between the elements.
### Components/Axes
The diagram consists of:
* **Nodes:** Six elements labeled A, B, C, X, Y, and Z. A, B, and C are represented as yellow triangles, while X, Y, and Z are represented as light blue circles.
* **Arrows:** Six blue arrows indicating a directional relationship. The arrows form a closed loop, connecting each element to the next in a clockwise direction.
* **Arrangement:** The elements are positioned in a roughly hexagonal shape, with A at the top, B on the bottom-right, C on the bottom-left, X on the top-left, Y on the top-right, and Z on the bottom.
### Detailed Analysis or Content Details
The diagram shows the following relationships:
* A -> Y (Arrow from A to Y)
* Y -> B (Arrow from Y to B)
* B -> Z (Arrow from B to Z)
* Z -> C (Arrow from Z to C)
* C -> X (Arrow from C to X)
* X -> A (Arrow from X to A)
The diagram is symmetrical in its arrangement and flow. Each element is both a source and a destination of an arrow.
### Key Observations
The diagram illustrates a closed-loop system where each element influences the next in a cyclical manner. There are no apparent starting or ending points, suggesting a continuous process or feedback loop. The distinction between triangular and circular nodes may indicate different types of elements or roles within the system, but this is not explicitly stated.
### Interpretation
The diagram likely represents a process or system with interconnected components. The cyclical nature suggests a feedback loop, where the output of one element influences the input of another, creating a continuous cycle. This could represent a variety of systems, such as:
* **A chemical reaction cycle:** Where each element represents a chemical compound and the arrows represent the reaction pathways.
* **A biological process:** Such as a metabolic pathway or a predator-prey relationship.
* **A business process:** Where each element represents a stage in the process and the arrows represent the flow of work.
* **A control system:** Where each element represents a component of the system and the arrows represent the control signals.
The use of different shapes (triangles and circles) could indicate different roles or types of elements within the system. For example, triangles might represent inputs or drivers, while circles might represent outputs or states. Without further context, the specific meaning of the diagram remains open to interpretation. The diagram is a visual representation of a system's interconnectedness and cyclical nature, emphasizing the importance of feedback and continuous flow.