## Diagram: Triangular Node Network with Cyclic Flow
### Overview
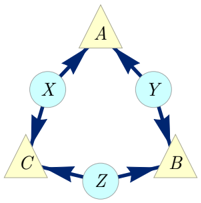
The image depicts a triangular network diagram with three primary nodes (A, B, C) arranged in a triangular formation. Each primary node connects to a secondary node (X, Y, Z) via directed arrows, forming a closed loop. The diagram uses color coding (yellow for primary nodes, light blue for secondary nodes) and directional arrows to indicate relationships.
### Components/Axes
- **Nodes**:
- **Primary Nodes**:
- A (top position, yellow triangle)
- B (bottom-right, yellow triangle)
- C (bottom-left, yellow triangle)
- **Secondary Nodes**:
- X (left-center, light blue circle)
- Y (right-center, light blue circle)
- Z (bottom-center, light blue circle)
- **Arrows**:
- Blue directional arrows connect nodes in the following sequence:
- A → X → C → Z → B → Y → A (forming a closed loop)
- **Color Legend**:
- Yellow: Primary nodes (A, B, C)
- Light Blue: Secondary nodes (X, Y, Z)
- Blue: Arrows (no explicit legend, inferred from visual context)
### Detailed Analysis
1. **Node Placement**:
- Primary nodes (A, B, C) form an equilateral triangle.
- Secondary nodes (X, Y, Z) are positioned between primary nodes:
- X between A and C
- Y between B and A
- Z between C and B
2. **Flow Direction**:
- Arrows create a cyclical path: A → X → C → Z → B → Y → A.
- No bidirectional or divergent arrows; all connections are unidirectional.
3. **Color Coding**:
- Primary nodes (yellow) are larger and more prominent.
- Secondary nodes (light blue) are smaller and intermediate in the flow.
### Key Observations
- The diagram emphasizes cyclical interdependence between primary and secondary nodes.
- Secondary nodes act as intermediaries in the flow between primary nodes.
- No explicit labels for arrows, but their direction is unambiguous from visual cues.
- Symmetry in node placement suggests balanced relationships.
### Interpretation
This diagram likely represents a **feedback loop** or **process flow** where:
- Primary nodes (A, B, C) represent core entities (e.g., departments, systems, or stages).
- Secondary nodes (X, Y, Z) symbolize transitional states, dependencies, or intermediate processes.
- The cyclical arrow pattern implies continuous interaction, such as:
- A data processing pipeline with feedback mechanisms.
- Organizational workflows requiring cross-departmental collaboration.
- A theoretical model of systemic interdependence (e.g., ecological or economic systems).
The absence of numerical data or explicit labels for arrows suggests the diagram prioritizes structural relationships over quantitative metrics. The closed loop reinforces the idea of perpetual motion or recurring processes.