\n
## Heatmap: Task Success Rate by Category and Agent
### Overview
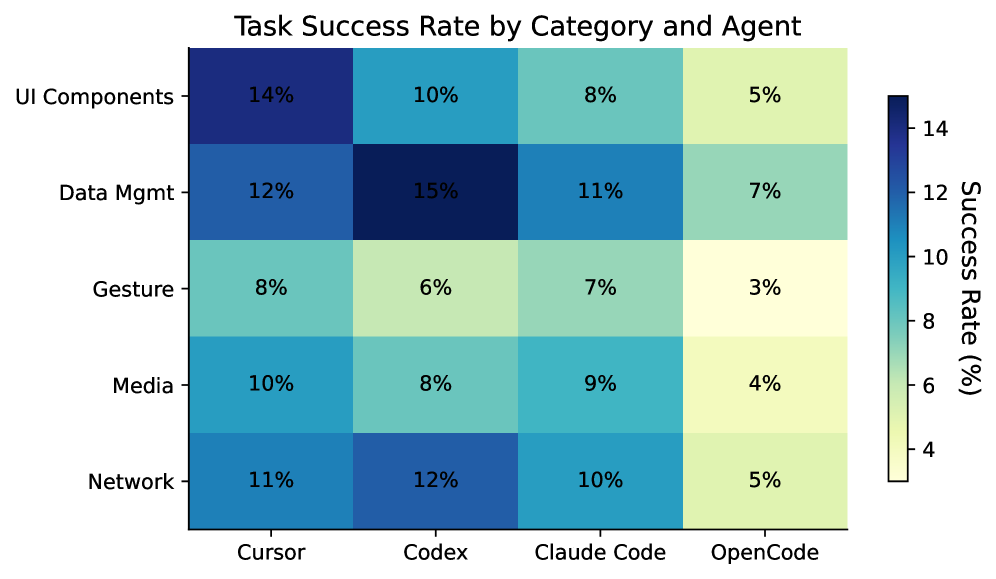
This heatmap visualizes the task success rate across five categories (UI Components, Data Mgmt, Gesture, Media, Network) and four agents (Cursor, Codex, Claude Code, OpenCode). The success rate is represented by color intensity, with darker blues indicating higher success rates and lighter yellows indicating lower success rates. A colorbar on the right indicates the success rate scale in percentage.
### Components/Axes
* **Title:** "Task Success Rate by Category and Agent" - positioned at the top-center.
* **X-axis:** Agent - with categories: Cursor, Codex, Claude Code, OpenCode.
* **Y-axis:** Category - with categories: UI Components, Data Mgmt, Gesture, Media, Network.
* **Colorbar:** Located on the right side, representing Success Rate (%) ranging from 4% (light yellow) to 14% (dark blue).
* **Data Labels:** Percentage values are displayed within each cell of the heatmap.
### Detailed Analysis
The heatmap displays the following success rates:
* **UI Components:**
* Cursor: 14%
* Codex: 10%
* Claude Code: 8%
* OpenCode: 5%
* **Data Mgmt:**
* Cursor: 12%
* Codex: 15%
* Claude Code: 11%
* OpenCode: 7%
* **Gesture:**
* Cursor: 8%
* Codex: 6%
* Claude Code: 7%
* OpenCode: 3%
* **Media:**
* Cursor: 10%
* Codex: 8%
* Claude Code: 9%
* OpenCode: 4%
* **Network:**
* Cursor: 11%
* Codex: 12%
* Claude Code: 10%
* OpenCode: 5%
**Trends:**
* **Cursor** generally performs best across all categories, with the highest success rate in UI Components (14%).
* **OpenCode** consistently shows the lowest success rates across all categories, with a minimum of 3% in Gesture.
* **Codex** shows the highest success rate in Data Mgmt (15%).
* Success rates for **Claude Code** are generally moderate and consistent across categories.
### Key Observations
* The highest success rate is 15% (Codex in Data Mgmt).
* The lowest success rate is 3% (OpenCode in Gesture).
* There's a noticeable difference in performance between Cursor and OpenCode across all categories.
* Data Mgmt has the highest success rates overall, while Gesture has the lowest.
### Interpretation
The heatmap suggests that the agent "Cursor" is the most reliable for task completion across all categories, while "OpenCode" struggles significantly. The category "Data Mgmt" appears to be the easiest for all agents to handle, while "Gesture" presents the greatest challenge.
The data could indicate that "OpenCode" requires further development or is not well-suited for the types of tasks being evaluated. The success rate differences between agents might be due to variations in their underlying algorithms, training data, or ability to handle specific task types. The higher success rate in "Data Mgmt" could be attributed to the nature of the tasks within that category, potentially being more straightforward or better aligned with the agents' capabilities.
Further investigation could involve analyzing the specific tasks within each category to understand why certain agents perform better or worse. It would also be valuable to explore the reasons behind the low success rates for "OpenCode" and identify areas for improvement. The heatmap provides a clear visual representation of agent performance and highlights areas where targeted interventions could be most effective.