## Heatmap Chart: Task Success Rate by Category and Agent
### Overview
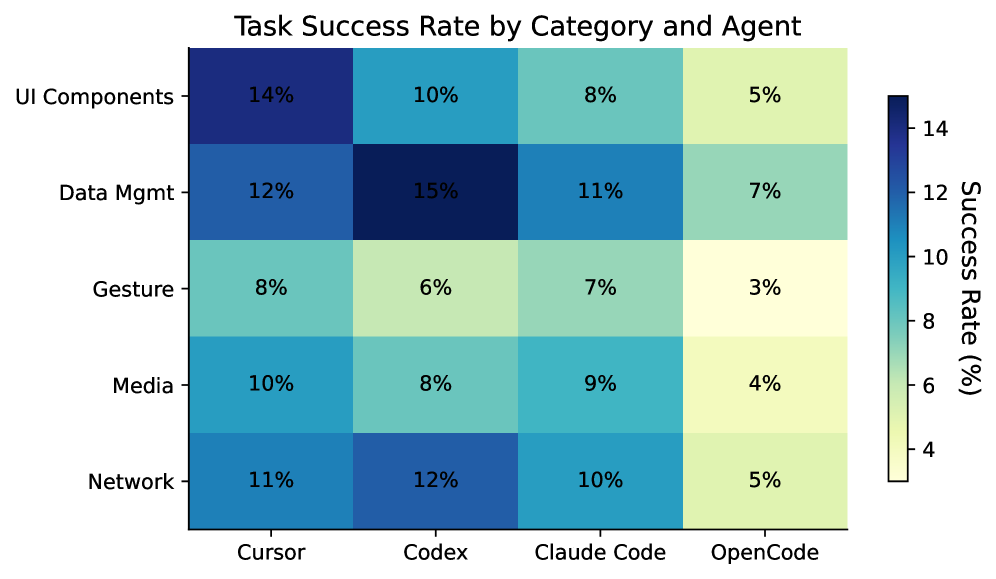
This image is a heatmap chart titled "Task Success Rate by Category and Agent." It visually compares the success rates (in percentages) of four different AI coding agents across five distinct task categories. The chart uses a color gradient to represent the success rate, with darker blues indicating higher percentages and lighter yellows indicating lower percentages.
### Components/Axes
* **Title:** "Task Success Rate by Category and Agent" (centered at the top).
* **Y-Axis (Vertical):** Labeled with five task categories. From top to bottom:
1. UI Components
2. Data Mgmt (Data Management)
3. Gesture
4. Media
5. Network
* **X-Axis (Horizontal):** Labeled with four AI agent names. From left to right:
1. Cursor
2. Codex
3. Claude Code
4. OpenCode
* **Legend/Color Scale:** Positioned on the right side of the chart. It is a vertical color bar labeled "Success Rate (%)". The scale ranges from approximately 4% (light yellow) at the bottom to 14% (dark blue) at the top, with intermediate markers at 6%, 8%, 10%, and 12%.
* **Data Grid:** A 5x4 grid of colored cells, each containing a percentage value representing the success rate for a specific agent-category pair.
### Detailed Analysis
The following table reconstructs the data presented in the heatmap. The color of each cell corresponds to the value, with darker blue for higher success rates.
| Category / Agent | Cursor | Codex | Claude Code | OpenCode |
| :--- | :--- | :--- | :--- | :--- |
| **UI Components** | 14% (Darkest Blue) | 10% (Medium Blue) | 8% (Teal) | 5% (Light Yellow-Green) |
| **Data Mgmt** | 12% (Medium Blue) | 15% (Very Dark Blue) | 11% (Medium Blue) | 7% (Light Green) |
| **Gesture** | 8% (Teal) | 6% (Light Green) | 7% (Light Green) | 3% (Lightest Yellow) |
| **Media** | 10% (Medium Blue) | 8% (Teal) | 9% (Teal) | 4% (Light Yellow) |
| **Network** | 11% (Medium Blue) | 12% (Medium Blue) | 10% (Medium Blue) | 5% (Light Yellow-Green) |
**Trend Verification per Category (Row):**
* **UI Components:** Success rate shows a clear **downward trend** from left to right: Cursor (14%) > Codex (10%) > Claude Code (8%) > OpenCode (5%).
* **Data Mgmt:** Success rate peaks in the second column (Codex) and is generally high: Codex (15%) > Cursor (12%) > Claude Code (11%) > OpenCode (7%).
* **Gesture:** Success rates are low overall, with a slight peak for Cursor: Cursor (8%) > Claude Code (7%) > Codex (6%) > OpenCode (3%).
* **Media:** Success rates are moderate, with a slight peak for Cursor: Cursor (10%) > Claude Code (9%) > Codex (8%) > OpenCode (4%).
* **Network:** Success rates are relatively consistent for the first three agents: Codex (12%) > Cursor (11%) > Claude Code (10%) > OpenCode (5%).
**Trend Verification per Agent (Column):**
* **Cursor:** Performs best in UI Components (14%) and worst in Gesture (8%).
* **Codex:** Achieves the highest single success rate in the chart (15% in Data Mgmt) and performs poorly in Gesture (6%).
* **Claude Code:** Shows relatively consistent performance, ranging from 7% (Gesture) to 11% (Data Mgmt).
* **OpenCode:** Consistently has the lowest success rate in every category, ranging from 3% (Gesture) to 7% (Data Mgmt).
### Key Observations
1. **Highest Performance:** The single highest success rate is **15%**, achieved by **Codex** in the **Data Mgmt** category.
2. **Lowest Performance:** The single lowest success rate is **3%**, achieved by **OpenCode** in the **Gesture** category.
3. **Agent Ranking:** In aggregate across all categories, **Cursor** and **Codex** appear to be the top-performing agents, while **OpenCode** is consistently the lowest-performing agent.
4. **Category Difficulty:** The **Gesture** category appears to be the most challenging overall, with the lowest average success rates. The **Data Mgmt** category shows the highest peak performance.
5. **Color-Value Correlation:** The color scale accurately reflects the numerical values. The darkest blue cell (Codex/Data Mgmt, 15%) is at the top of the scale, and the lightest yellow cell (OpenCode/Gesture, 3%) is below the bottom of the labeled scale (4%).
### Interpretation
This heatmap provides a comparative performance analysis of AI coding agents. The data suggests that task success is highly dependent on both the specific agent and the type of task.
* **Agent Specialization:** **Codex** demonstrates a clear strength in **Data Management** tasks. **Cursor** shows strong, often leading, performance in **UI Components** and **Media**. This implies different agents may be better suited for different development domains.
* **General-Purpose vs. Weak Performance:** **Claude Code** exhibits the most consistent, middle-of-the-road performance, suggesting it may be a more general-purpose agent without extreme strengths or weaknesses in these categories. **OpenCode**'s uniformly low scores indicate it may be less capable or less optimized for these specific task types compared to the others.
* **Task Complexity:** The uniformly low scores in the **Gesture** category suggest that tasks involving gesture recognition or implementation are particularly difficult for current AI coding agents, representing a potential area for future improvement.
* **Practical Implication:** A developer or team choosing an agent for a project heavy on data management might prioritize Codex, while one focused on building user interfaces might lean towards Cursor. For a project involving gesture control, all agents show significant room for improvement, and human oversight would be crucial.
**Language Declaration:** All text within the image is in English. No other languages are present.