## Heatmap: Task Success Rate by Category and Agent
### Overview
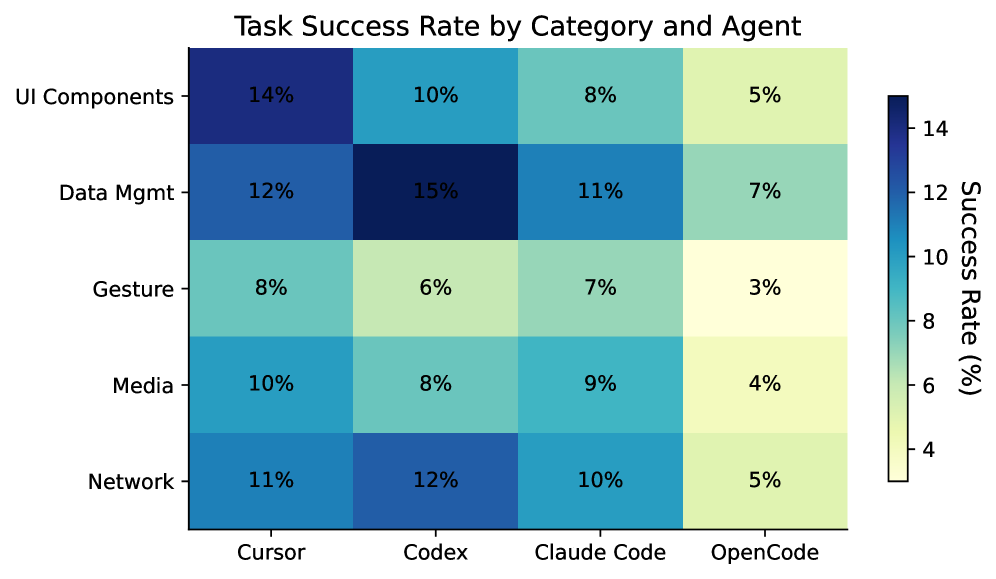
The heatmap visualizes task success rates across five categories (UI Components, Data Mgmt, Gesture, Media, Network) and four agents (Cursor, Codex, Claude Code, OpenCode). Success rates are represented by color intensity, with darker blue indicating higher rates (14%) and lighter yellow indicating lower rates (3%).
### Components/Axes
- **X-axis (Agents)**: Cursor, Codex, Claude Code, OpenCode
- **Y-axis (Task Categories)**: UI Components, Data Mgmt, Gesture, Media, Network
- **Legend**: Right-aligned color gradient from light yellow (3%) to dark blue (14%)
- **Title**: "Task Success Rate by Category and Agent" (top-center)
### Detailed Analysis
| Task Category | Cursor | Codex | Claude Code | OpenCode |
|-----------------|--------|-------|-------------|----------|
| **UI Components** | 14% | 10% | 8% | 5% |
| **Data Mgmt** | 12% | 15% | 11% | 7% |
| **Gesture** | 8% | 6% | 7% | 3% |
| **Media** | 10% | 8% | 9% | 4% |
| **Network** | 11% | 12% | 10% | 5% |
- **Color Consistency**: All cells match the legend (e.g., 14% = dark blue, 3% = light yellow).
- **Spatial Layout**:
- Title: Top-center
- Legend: Right-aligned vertical bar
- Data cells: Grid with rounded corners
### Key Observations
1. **Highest Success Rates**:
- **Codex** leads in **Data Mgmt** (15%) and **Network** (12%).
- **Cursor** excels in **UI Components** (14%) and **Network** (11%).
2. **Lowest Success Rates**:
- **Gesture** tasks perform poorly across all agents, with **OpenCode** at 3%.
- **OpenCode** generally underperforms (e.g., 4% for Media, 5% for UI Components).
3. **Trends**:
- **Codex** and **Cursor** show stronger performance in technical tasks (Data Mgmt, Network).
- **Gesture** tasks degrade significantly with OpenCode (3% vs. 8% for Cursor).
### Interpretation
The data suggests **Codex** and **Cursor** are more effective for technical tasks (e.g., Data Mgmt, Network), while **OpenCode** struggles across most categories. **Gesture** tasks are universally challenging, indicating potential limitations in agent capabilities for non-technical interactions. The disparity in success rates highlights the need for agent specialization or task-specific optimization. Notably, **Codex**’s 15% success rate in Data Mgmt stands out as an outlier, suggesting exceptional performance in structured data handling.