\n
## Bar Chart: F1 Score and BLEU-1 vs. k Values
### Overview
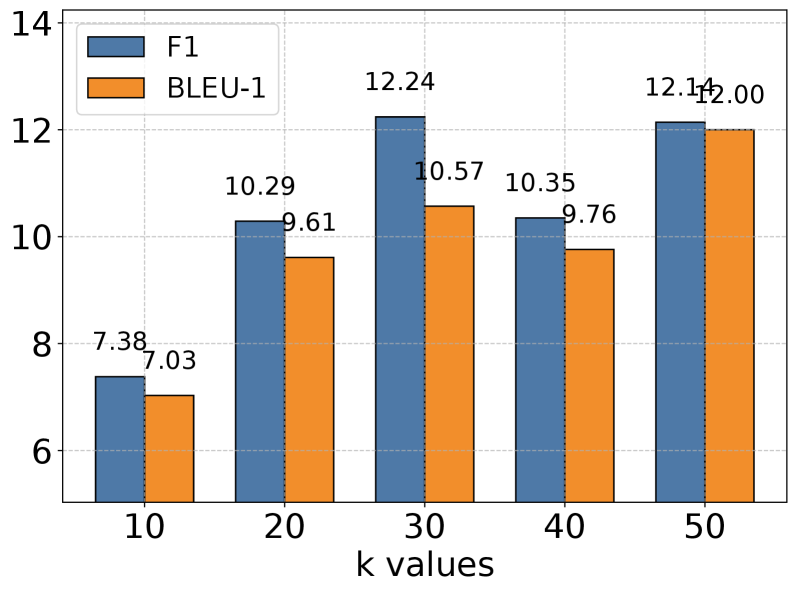
This image presents a bar chart comparing the F1 score and BLEU-1 metric values across different 'k' values. The chart displays two data series as bar graphs, with 'k values' on the x-axis and the metric scores on the y-axis.
### Components/Axes
* **X-axis:** "k values" with markers at 10, 20, 30, 40, and 50.
* **Y-axis:** Scale ranging from 6 to 14, representing the metric scores.
* **Legend:** Located in the top-left corner.
* Blue bars: "F1"
* Orange bars: "BLEU-1"
### Detailed Analysis
The chart shows the following data points:
* **k = 10:**
* F1: Approximately 7.38
* BLEU-1: Approximately 7.03
* **k = 20:**
* F1: Approximately 10.29
* BLEU-1: Approximately 9.61
* **k = 30:**
* F1: Approximately 12.24
* BLEU-1: Approximately 10.57
* **k = 40:**
* F1: Approximately 10.35
* BLEU-1: Approximately 9.76
* **k = 50:**
* F1: Approximately 12.14
* BLEU-1: Approximately 12.00
**Trends:**
* **F1:** The F1 score generally increases as 'k' increases from 10 to 30, then decreases slightly at k=40, and increases again at k=50.
* **BLEU-1:** The BLEU-1 score also increases as 'k' increases from 10 to 30, then decreases at k=40, and increases again at k=50, but the increase is less pronounced than that of the F1 score.
### Key Observations
* Both F1 and BLEU-1 scores show a positive correlation with 'k' up to a point (k=30), after which the F1 score decreases slightly before increasing again.
* The F1 score consistently outperforms the BLEU-1 score across all 'k' values.
* The largest difference between the two metrics occurs at k=30, where F1 is approximately 1.67 higher than BLEU-1.
### Interpretation
The chart suggests that increasing the 'k' value (likely representing a parameter in a model or algorithm) generally improves performance, as measured by both F1 and BLEU-1 scores, up to a certain point. The slight dip in F1 at k=40 could indicate overfitting or diminishing returns. The consistent higher F1 scores suggest that this metric is a more sensitive indicator of performance in this context than BLEU-1. The data implies an optimal 'k' value around 30 or 50, depending on the specific goals and trade-offs between the two metrics. The relationship between 'k' and the metrics suggests a potential for tuning this parameter to optimize model performance.