# Technical Document Extraction: Bar Chart Analysis
## 1. Chart Components
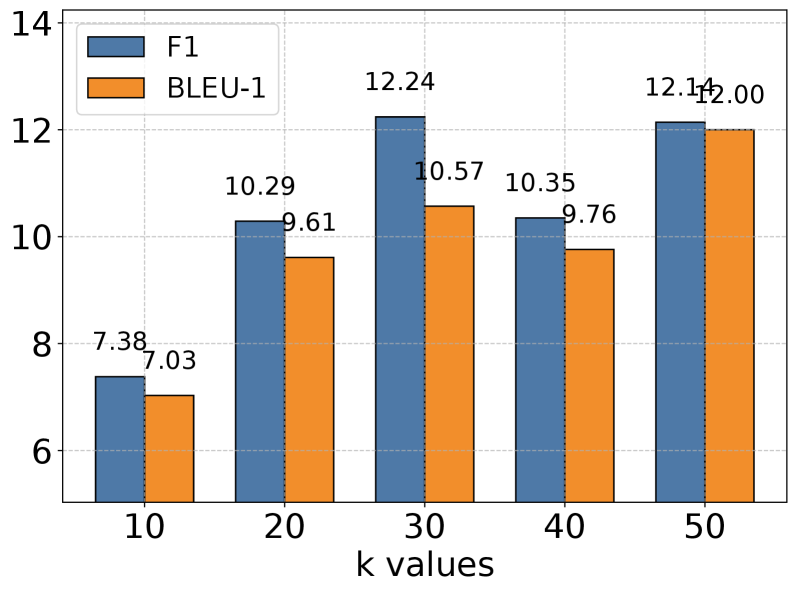
- **Chart Type**: Grouped Bar Chart
- **Legend**:
- Position: Top-left corner
- Entries:
- `F1` (Blue)
- `BLEU-1` (Orange)
## 2. Axis Labels
- **X-Axis**:
- Title: "k values"
- Categories: 10, 20, 30, 40, 50
- Tick Spacing: 10 units
- **Y-Axis**:
- Title: Unlabeled
- Range: 6 to 14
- Tick Spacing: 2 units
## 3. Data Points
| k Value | F1 (Blue) | BLEU-1 (Orange) |
|---------|-----------|-----------------|
| 10 | 7.38 | 7.03 |
| 20 | 10.29 | 9.61 |
| 30 | 12.24 | 10.57 |
| 40 | 10.35 | 9.76 |
| 50 | 12.14 | 12.00 |
## 4. Trend Analysis
- **F1 Series**:
- Initial increase: 7.38 (k=10) → 12.24 (k=30)
- Subsequent dip: 12.24 (k=30) → 10.35 (k=40)
- Final rise: 10.35 (k=40) → 12.14 (k=50)
- Overall trend: **Upward with mid-range fluctuation**
- **BLEU-1 Series**:
- Steady growth: 7.03 (k=10) → 10.57 (k=30)
- Mid-range dip: 10.57 (k=30) → 9.76 (k=40)
- Sharp recovery: 9.76 (k=40) → 12.00 (k=50)
- Overall trend: **Upward with mid-range volatility**
## 5. Spatial Grounding
- **Legend**: Top-left corner (confirmed via positional alignment)
- **Bar Grouping**:
- Each k-value cluster contains two bars (F1 and BLEU-1)
- Bars are side-by-side with consistent spacing
- **Y-Axis Alignment**:
- Numerical markers (6, 8, 10, 12, 14) are evenly spaced
- No axis title present
## 6. Color Verification
- All blue bars correspond to F1 values (legend match confirmed)
- All orange bars correspond to BLEU-1 values (legend match confirmed)
## 7. Structural Notes
- No textual annotations outside legend/data labels
- No secondary axes or annotations present
- Chart focuses on comparative performance of F1 and BLEU-1 metrics across k-values
## 8. Missing Elements
- Y-Axis Title: Not provided in image
- Units of measurement: Not specified
- Source/Context: Not included in image
## 9. Key Observations
1. Both metrics show improvement as k increases from 10 to 50
2. F1 demonstrates higher variability (e.g., 12.24 → 10.35 drop at k=40)
3. BLEU-1 achieves parity with F1 at k=50 (12.00 vs 12.14)
4. Mid-range performance (k=20-40) shows divergence between metrics