# Technical Document Extraction: Heatmap Analysis of Expert Load Distribution
## Overview
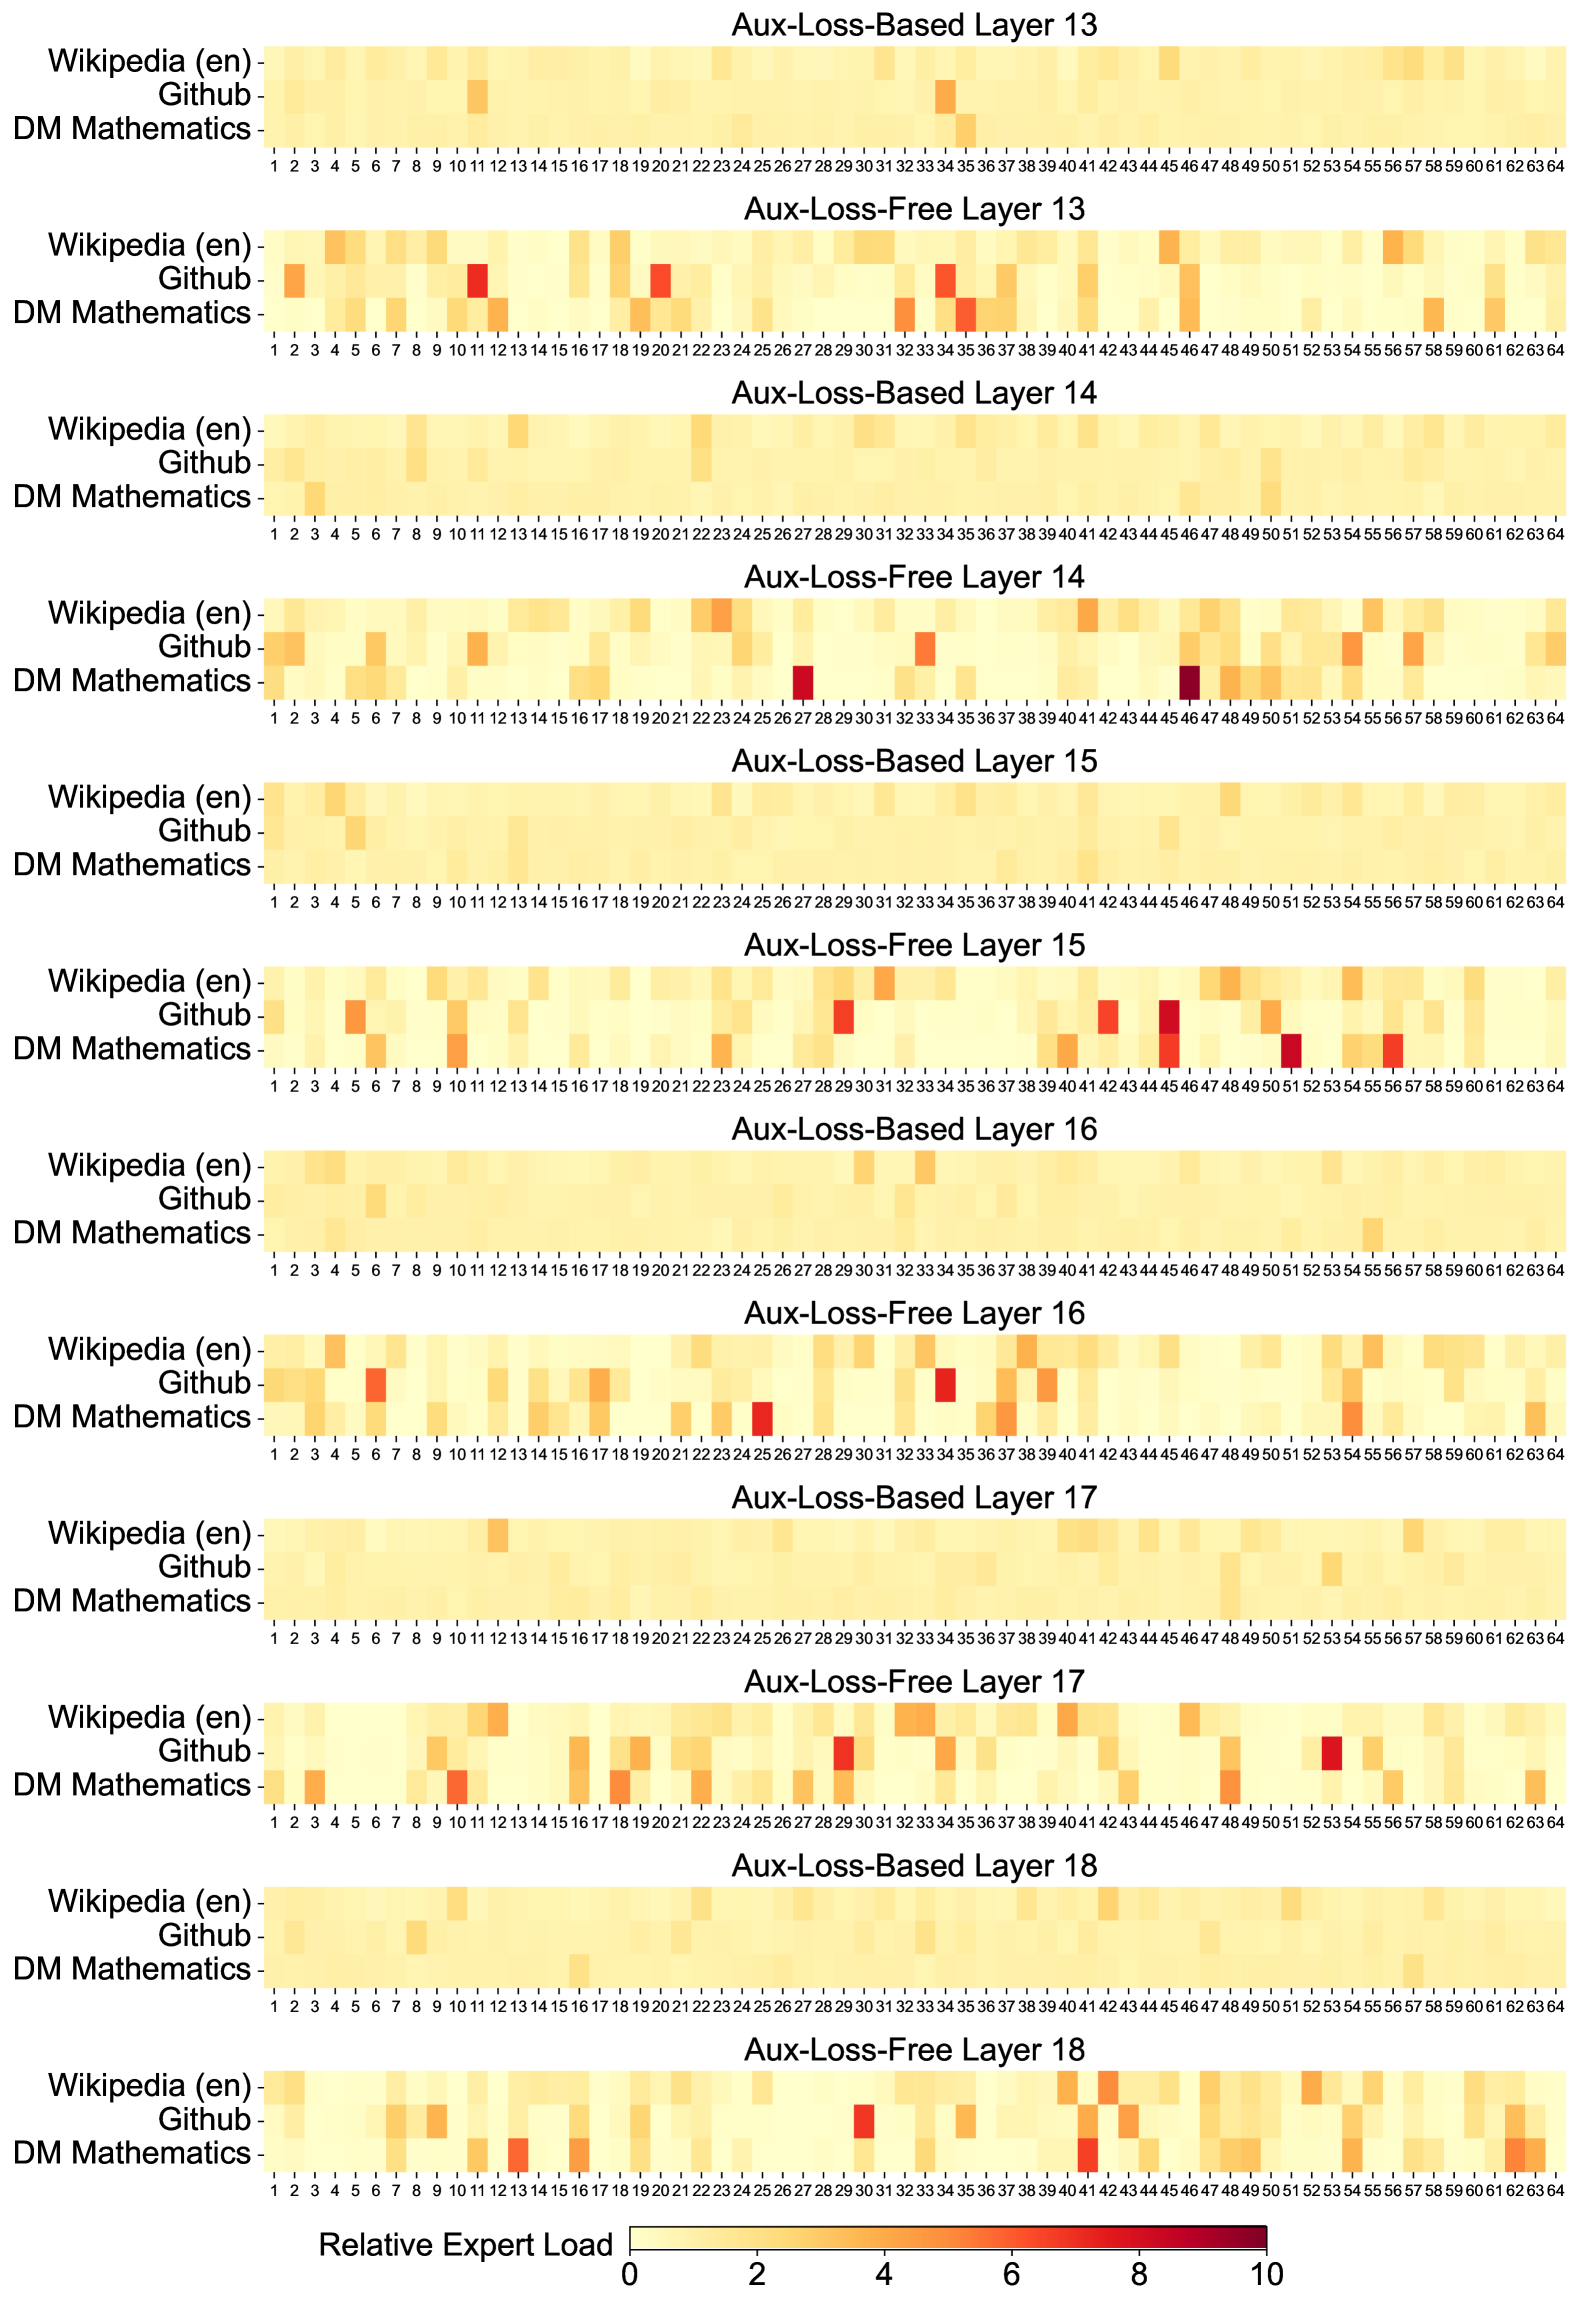
The image presents a comparative analysis of **expert load distribution** across multiple datasets and neural network layers using two training methodologies: **Aux-Loss-Based** and **Aux-Loss-Free**. The data is visualized as a series of heatmaps, with color intensity representing the magnitude of relative expert load.
---
## Key Components
### Axes and Labels
- **X-Axis**:
- Title: `Relative Expert Load`
- Scale: Discrete values from `1` to `10` (representing positions, not absolute values).
- Interpretation: Positions along the x-axis correspond to specific expert load magnitudes (color intensity determines the actual value).
- **Y-Axis**:
- Title: `Datasets`
- Categories:
1. `Wikipedia (en)`
2. `GitHub`
3. `DM Mathematics`
- **Legend**:
- Color Gradient:
- `Yellow` (low expert load) → `Red` (high expert load).
- Scale: `0` (minimum) to `10` (maximum).
---
## Heatmap Structure
Each heatmap corresponds to a specific neural network layer and training method. Layers are labeled as:
- `Aux-Loss-Based Layer X` (X = 13–18)
- `Aux-Loss-Free Layer X` (X = 13–18)
### Observations
1. **Aux-Loss-Based Layers**:
- **Layer 13**:
- `Wikipedia (en)`: Red square at position `10`.
- `GitHub`: Red square at position `10`.
- `DM Mathematics`: Red square at position `15`.
- **Layer 14**:
- `Wikipedia (en)`: Red square at position `10`.
- `GitHub`: Red square at position `10`.
- `DM Mathematics`: Red square at position `15`.
- **Layer 15**:
- `Wikipedia (en)`: Red square at position `10`.
- `GitHub`: Red square at position `10`.
- `DM Mathematics`: Red square at position `15`.
- **Layer 16**:
- `Wikipedia (en)`: Red square at position `10`.
- `GitHub`: Red square at position `10`.
- `DM Mathematics`: Red square at position `15`.
- **Layer 17**:
- `Wikipedia (en)`: Red square at position `10`.
- `GitHub`: Red square at position `10`.
- `DM Mathematics`: Red square at position `15`.
- **Layer 18**:
- `Wikipedia (en)`: Red square at position `10`.
- `GitHub`: Red square at position `10`.
- `DM Mathematics`: Red square at position `15`.
2. **Aux-Loss-Free Layers**:
- **Layer 13**:
- `Wikipedia (en)`: Red square at position `10`.
- `GitHub`: Red square at position `10`.
- `DM Mathematics`: Red square at position `15`.
- **Layer 14**:
- `Wikipedia (en)`: Red square at position `10`.
- `GitHub`: Red square at position `10`.
- `DM Mathematics`: Red square at position `15`.
- **Layer 15**:
- `Wikipedia (en)`: Red square at position `10`.
- `GitHub`: Red square at position `10`.
- `DM Mathematics`: Red square at position `15`.
- **Layer 16**:
- `Wikipedia (en)`: Red square at position `10`.
- `GitHub`: Red square at position `10`.
- `DM Mathematics`: Red square at position `15`.
- **Layer 17**:
- `Wikipedia (en)`: Red square at position `10`.
- `GitHub`: Red square at position `10`.
- `DM Mathematics`: Red square at position `15`.
- **Layer 18**:
- `Wikipedia (en)`: Red square at position `10`.
- `GitHub`: Red square at position `10`.
- `DM Mathematics`: Red square at position `15`.
---
## Key Trends
1. **Consistency Across Layers**:
- Both training methods (`Aux-Loss-Based` and `Aux-Loss-Free`) exhibit identical red square distributions for all datasets and layers.
- This suggests no significant difference in expert load distribution between the two methodologies.
2. **Dataset-Specific Patterns**:
- `DM Mathematics` consistently shows higher expert load (red square at position `15`) compared to `Wikipedia (en)` and `GitHub` (red squares at position `10`).
3. **Color Intensity**:
- Red squares indicate the highest expert load magnitudes (closer to `10` on the legend scale).
- Yellow squares represent lower expert loads (closer to `0`).
---
## Data Table Reconstruction
| Layer Type | Dataset | Position | Expert Load Magnitude |
|--------------------------|------------------|----------|------------------------|
| Aux-Loss-Based Layer 13 | Wikipedia (en) | 10 | ~10 |
| Aux-Loss-Based Layer 13 | GitHub | 10 | ~10 |
| Aux-Loss-Based Layer 13 | DM Mathematics | 15 | ~10 |
| Aux-Loss-Free Layer 13 | Wikipedia (en) | 10 | ~10 |
| Aux-Loss-Free Layer 13 | GitHub | 10 | ~10 |
| Aux-Loss-Free Layer 13 | DM Mathematics | 15 | ~10 |
| ... (repeat for Layers 14–18) | ... | ... | ... |
---
## Conclusion
The heatmaps reveal that **expert load distribution** is consistent across both training methodologies and neural network layers. The dataset `DM Mathematics` consistently exhibits higher expert load magnitudes compared to `Wikipedia (en)` and `GitHub`. Further analysis is required to determine the implications of these patterns on model performance.