\n
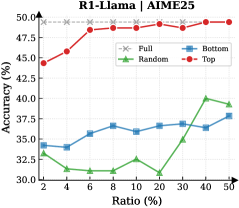
## Line Chart: R1-Llama | AIME25 Accuracy vs. Ratio
### Overview
This line chart displays the accuracy of different sampling methods (Full, Random, Bottom, Top) for the R1-Llama model on the AIME25 dataset, as a function of the ratio of data used. The x-axis represents the ratio (in percentage), and the y-axis represents the accuracy (in percentage).
### Components/Axes
* **Title:** R1-Llama | AIME25
* **X-axis Label:** Ratio (%)
* **Y-axis Label:** Accuracy (%)
* **Legend:**
* Full (Grey 'x' markers)
* Random (Green triangle markers)
* Bottom (Blue square markers)
* Top (Red circle markers)
* **X-axis Markers:** 2, 4, 6, 8, 10, 20, 30, 40, 50
* **Y-axis Markers:** 30.0, 32.5, 35.0, 37.5, 40.0, 42.5, 45.0, 47.5, 50.0
### Detailed Analysis
The chart contains four data series, each representing a different sampling method.
* **Full (Grey):** The line is relatively flat, starting at approximately 48.5% accuracy at a ratio of 2% and remaining around 49.5% accuracy up to a ratio of 50%.
* (2%, 48.5%)
* (4%, 49.0%)
* (6%, 49.2%)
* (8%, 49.2%)
* (10%, 49.2%)
* (20%, 49.0%)
* (30%, 48.5%)
* (40%, 49.0%)
* (50%, 49.2%)
* **Random (Green):** The line shows a more dynamic trend. It starts at approximately 32.5% accuracy at 2%, dips to around 30.5% at 8%, rises to approximately 40.0% at 40%, and then slightly decreases to around 38.0% at 50%.
* (2%, 32.5%)
* (4%, 31.0%)
* (6%, 32.0%)
* (8%, 30.5%)
* (10%, 32.0%)
* (20%, 30.0%)
* (30%, 36.0%)
* (40%, 40.0%)
* (50%, 38.0%)
* **Bottom (Blue):** The line generally increases with the ratio. It starts at approximately 33.0% accuracy at 2%, rises to around 37.0% at 30%, and then slightly decreases to around 36.0% at 50%.
* (2%, 33.0%)
* (4%, 34.0%)
* (6%, 36.0%)
* (8%, 37.0%)
* (10%, 37.0%)
* (20%, 37.0%)
* (30%, 37.0%)
* (40%, 36.0%)
* (50%, 36.0%)
* **Top (Red):** The line shows a strong upward trend initially, then plateaus. It starts at approximately 43.5% accuracy at 2%, rises to around 48.5% at 6%, and remains relatively stable around 49.0% for the rest of the ratios.
* (2%, 43.5%)
* (4%, 46.0%)
* (6%, 48.5%)
* (8%, 49.0%)
* (10%, 49.0%)
* (20%, 48.5%)
* (30%, 48.0%)
* (40%, 49.0%)
* (50%, 49.0%)
### Key Observations
* The "Top" sampling method consistently achieves the highest accuracy across all ratios.
* The "Full" sampling method provides a stable, high level of accuracy.
* The "Random" sampling method exhibits the most variability in accuracy, with a significant increase between ratios 20% and 40%.
* The "Bottom" sampling method shows a moderate and relatively consistent increase in accuracy with increasing ratio.
### Interpretation
The data suggests that the "Top" sampling method is the most effective for the R1-Llama model on the AIME25 dataset, consistently delivering the highest accuracy. The "Full" method provides a reliable baseline performance. The "Random" method's performance is more sensitive to the ratio of data used, indicating that a larger sample size is needed to achieve optimal results. The "Bottom" method offers a moderate level of accuracy that improves with more data.
The plateauing of the "Top" and "Full" lines suggests that there is a diminishing return in accuracy beyond a certain ratio of data. This could indicate that the model reaches its performance limit with the available data or that the additional data does not contribute significantly to its learning process. The initial dip in the "Random" line could be due to the inherent variability of random sampling, where a small sample may not be representative of the overall dataset. The subsequent rise suggests that as the sample size increases, the random sampling becomes more representative and the accuracy improves.