## Line Chart: R1-Llama | AIME25
### Overview
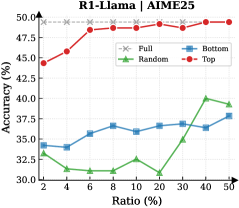
The chart compares the accuracy (%) of four different strategies ("Full", "Bottom", "Random", "Top") across varying ratios (%) from 2 to 50. Accuracy is measured on the y-axis (30–50%), while the x-axis represents the ratio (%) in increments of 2. The legend is positioned in the top-right corner, with distinct markers for each strategy.
### Components/Axes
- **X-axis (Ratio %)**: Labeled "Ratio (%)", ranging from 2 to 50 in increments of 2.
- **Y-axis (Accuracy %)**: Labeled "Accuracy (%)", ranging from 30 to 50 in increments of 2.5.
- **Legend**: Located in the top-right corner, with four entries:
- **Full**: Gray stars (★)
- **Bottom**: Blue squares (■)
- **Random**: Green triangles (▲)
- **Top**: Red circles (●)
### Detailed Analysis
1. **Full (Gray Stars)**:
- Constant accuracy at **49.5%** across all ratios.
- No variation observed; represents a baseline or theoretical maximum.
2. **Bottom (Blue Squares)**:
- Starts at **34%** (ratio 2%), gradually increases to **38.5%** (ratio 50%).
- Minor fluctuations: dips to **33.5%** at ratio 4%, peaks at **38.5%** at ratio 50%.
3. **Random (Green Triangles)**:
- Highly variable, with no clear trend.
- Peaks at **40%** (ratio 40%), then drops to **39%** (ratio 50%).
- Lowest point at **30%** (ratio 20%).
4. **Top (Red Circles)**:
- Steady upward trend from **44%** (ratio 2%) to **49.5%** (ratio 50%).
- Consistent growth with minor plateaus (e.g., 48% at ratio 10%).
### Key Observations
- **Top strategy** demonstrates the most significant improvement, outperforming all others by 50% ratio.
- **Random strategy** exhibits erratic behavior, with a sharp dip at 20% ratio and a late surge at 40%.
- **Full strategy** remains static, suggesting it may represent an ideal or control scenario.
- **Bottom strategy** shows moderate growth but lags behind Top and Full.
### Interpretation
The data suggests that the **Top strategy** is the most effective, with accuracy increasing linearly as the ratio grows. The **Random strategy**’s volatility implies a lack of systematic improvement, possibly due to unstructured sampling. The **Full strategy**’s constant high accuracy may indicate an optimal or theoretical ceiling, while the **Bottom strategy** represents a middle-ground approach with gradual but limited gains. The anomalies in the Random series (e.g., the 20% ratio dip) could reflect outliers or contextual factors not captured in the chart. Overall, the chart highlights the importance of structured, incremental improvements (Top) over random or static approaches.