# Technical Document Extraction: GRPO Reward System Architecture
## 1. Overview
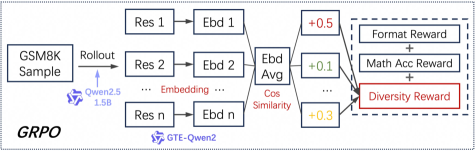
This image is a technical flow diagram illustrating a Group Relative Policy Optimization (**GRPO**) reinforcement learning pipeline, specifically focusing on how a "Diversity Reward" is calculated for a mathematical reasoning task (GSM8K). The process involves generating multiple responses, embedding them, and calculating similarity scores to encourage output variety.
---
## 2. Component Isolation & Flow Analysis
The diagram flows from left to right, segmented into four primary functional regions:
### Region 1: Input and Rollout (Left)
* **Input Node:** A box labeled **"GSM8K Sample"**.
* **Process:** An arrow labeled **"Rollout"** points to the next stage.
* **Model Attribution:** Below the rollout arrow, there is a logo and blue text identifying the model: **"Qwen2.5 1.5B"**.
### Region 2: Response Generation and Embedding (Center-Left)
The system generates $n$ parallel responses from the single input sample.
* **Responses (Res):** Three boxes stacked vertically labeled **"Res 1"**, **"Res 2"**, and **"Res n"** (with an ellipsis "..." indicating multiple intermediate responses).
* **Embeddings (Ebd):** Each response box points to a corresponding embedding box: **"Ebd 1"**, **"Ebd 2"**, and **"Ebd n"**.
* **Embedding Model:** Red text below this section reads **"... Embedding ..."**. A logo and purple text at the bottom identifies the embedding model: **"GTE-Qwen2"**.
### Region 3: Similarity Calculation (Center-Right)
* **Aggregation Node:** All embedding boxes converge into a central box labeled **"Ebd Avg"**.
* **Metric:** Red text below this box specifies the calculation method: **"Cos Similarity"** (Cosine Similarity).
* **Individual Scores:** The "Ebd Avg" node points to three individual score boxes representing the relative similarity/diversity values for each response:
* **+0.5** (Red text)
* **+0.1** (Green text)
* **+0.3** (Yellow text)
* An ellipsis "**...**" indicates scores for intermediate responses.
### Region 4: Reward Summation (Right)
The final stage is enclosed in a dashed-line box, representing the total reward function.
* **Component 1:** **"Format Reward"**
* **Operator:** **+**
* **Component 2:** **"Math Acc Reward"** (Math Accuracy Reward)
* **Operator:** **+**
* **Component 3:** **"Diversity Reward"** (Highlighted in a red-bordered box). The individual scores from Region 3 feed directly into this component.
---
## 3. Textual Transcription
| Category | Transcribed Text | Context/Notes |
| :--- | :--- | :--- |
| **Main Title/Label** | `GRPO` | Located at bottom-left; refers to Group Relative Policy Optimization. |
| **Input** | `GSM8K Sample` | Dataset used for mathematical word problems. |
| **Action** | `Rollout` | The generation of multiple completions. |
| **Models** | `Qwen2.5 1.5B`, `GTE-Qwen2` | The LLM and the Embedding model respectively. |
| **Data Nodes** | `Res 1`, `Res 2`, `Res n` | Responses 1 through $n$. |
| **Data Nodes** | `Ebd 1`, `Ebd 2`, `Ebd n` | Embeddings 1 through $n$. |
| **Process Nodes** | `Ebd Avg` | The average embedding of the group. |
| **Metrics** | `Cos Similarity` | Mathematical method for comparing embeddings. |
| **Values** | `+0.5`, `+0.1`, `+0.3` | Numerical outputs of the similarity/diversity check. |
| **Reward Components**| `Format Reward`, `Math Acc Reward`, `Diversity Reward` | The three pillars of the reinforcement learning reward signal. |
---
## 4. Logic and Trend Verification
1. **Group Dynamics:** The diagram confirms the "Group" aspect of GRPO by showing $n$ responses generated from a single sample.
2. **Diversity Logic:** By calculating the "Ebd Avg" and using "Cos Similarity," the system identifies how similar a specific response is to the rest of the group. The resulting values (+0.5, +0.1, +0.3) are then used to populate the **Diversity Reward**.
3. **Total Reward Construction:** The final reward is an additive composite:
$$\text{Total Reward} = \text{Format Reward} + \text{Math Acc Reward} + \text{Diversity Reward}$$
4. **Color Coding:** The use of different colors for the numerical values (+0.5 red, +0.1 green, +0.3 yellow) likely indicates the degree of diversity or the magnitude of the reward assigned to that specific response relative to the group mean.