## Heatmap: Baseline - Short-to-Long - Qwen-2.5 7B
### Overview
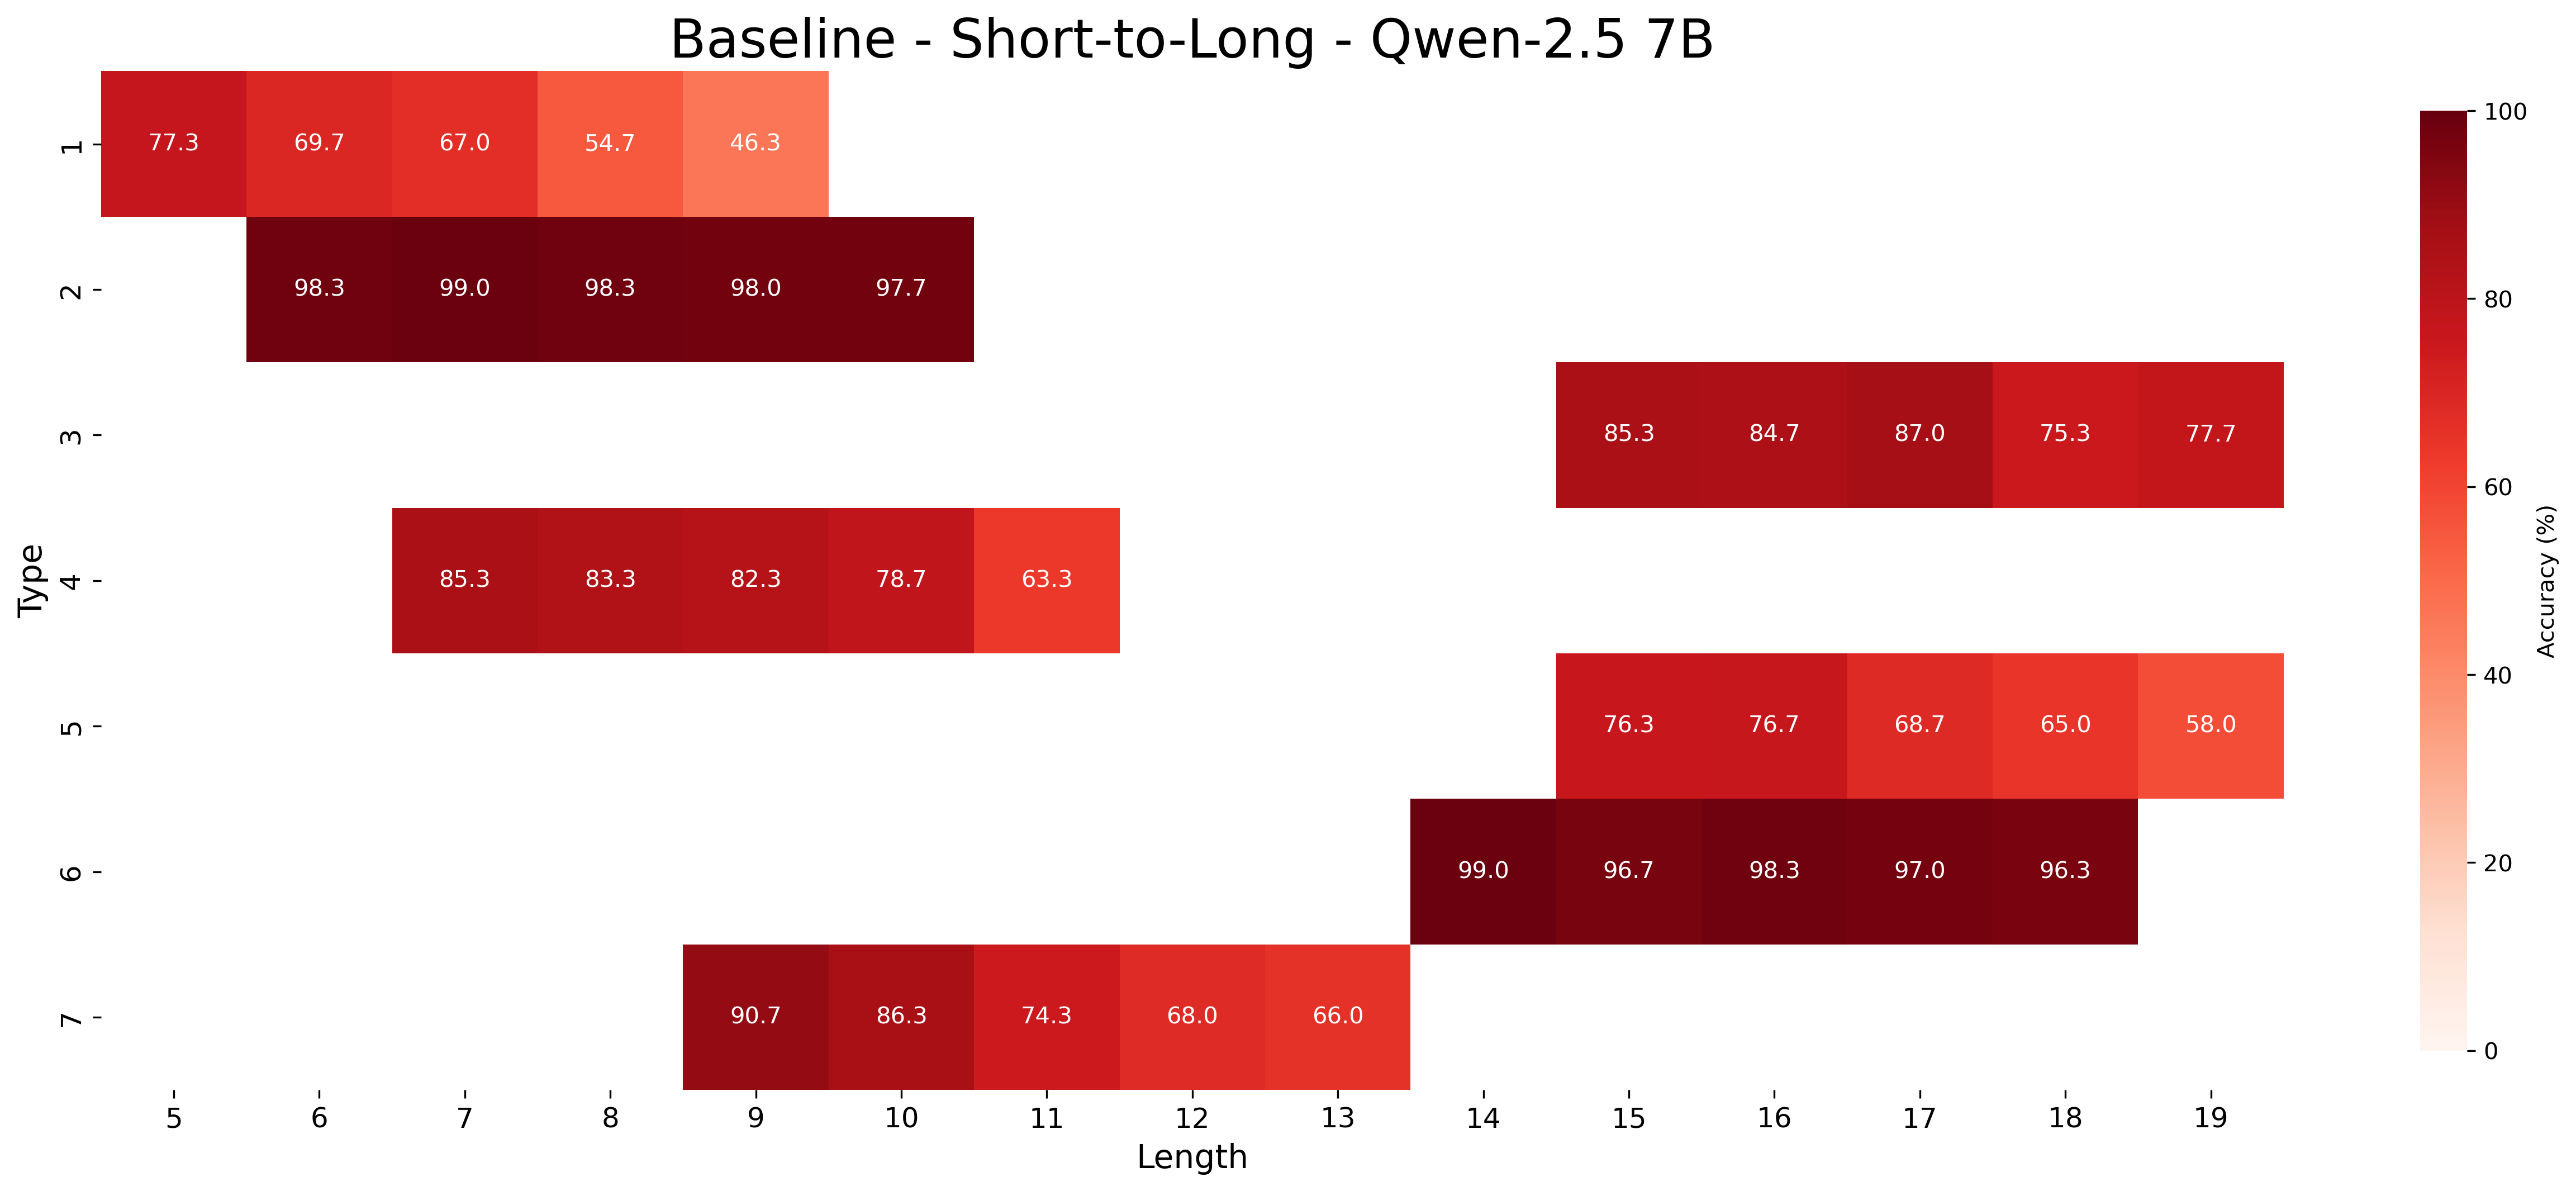
The image is a heatmap displaying accuracy percentages for different types of data across varying lengths. The heatmap uses a color gradient from white to dark red, where darker shades of red indicate higher accuracy. The x-axis represents "Length," and the y-axis represents "Type."
### Components/Axes
* **Title:** Baseline - Short-to-Long - Qwen-2.5 7B
* **X-axis:**
* Label: Length
* Scale: 5 to 19 in integer increments.
* **Y-axis:**
* Label: Type
* Scale: 1 to 7 in integer increments.
* **Color Legend:** Located on the right side of the heatmap.
* Label: Accuracy (%)
* Scale: 0 to 100, with increments of 20. White corresponds to 0%, and dark red corresponds to 100%.
### Detailed Analysis or Content Details
The heatmap presents accuracy values for each combination of "Type" and "Length." Each cell contains a numerical value representing the accuracy percentage.
* **Type 1:**
* Length 5: 77.3
* Length 6: 69.7
* Length 7: 67.0
* Length 8: 54.7
* Length 9: 46.3
* Trend: Accuracy decreases as length increases.
* **Type 2:**
* Length 7: 98.3
* Length 8: 99.0
* Length 9: 98.3
* Length 10: 98.0
* Length 11: 97.7
* Trend: Accuracy is consistently high (around 98-99%) with a slight decrease.
* **Type 3:**
* Length 14: 85.3
* Length 15: 84.7
* Length 16: 87.0
* Length 17: 75.3
* Length 18: 77.7
* Trend: Accuracy fluctuates, with a dip at length 17.
* **Type 4:**
* Length 7: 85.3
* Length 8: 83.3
* Length 9: 82.3
* Length 10: 78.7
* Length 11: 63.3
* Trend: Accuracy decreases as length increases.
* **Type 5:**
* Length 15: 76.3
* Length 16: 76.7
* Length 17: 68.7
* Length 18: 65.0
* Length 19: 58.0
* Trend: Accuracy decreases as length increases.
* **Type 6:**
* Length 14: 99.0
* Length 15: 96.7
* Length 16: 98.3
* Length 17: 97.0
* Length 18: 96.3
* Trend: Accuracy is consistently high (around 96-99%) with slight fluctuations.
* **Type 7:**
* Length 9: 90.7
* Length 10: 86.3
* Length 11: 74.3
* Length 12: 68.0
* Length 13: 66.0
* Trend: Accuracy decreases as length increases.
### Key Observations
* Types 2 and 6 generally exhibit the highest accuracy across their respective lengths.
* Types 1, 4, 5, and 7 show a decreasing trend in accuracy as length increases.
* Type 3 shows a more fluctuating accuracy pattern.
### Interpretation
The heatmap visualizes the performance of a model (Qwen-2.5 7B) under different conditions, specifically varying "Type" and "Length." The data suggests that certain types are more robust to changes in length than others. Types 2 and 6 maintain high accuracy even as length increases, while Types 1, 4, 5, and 7 experience a noticeable drop in accuracy. This could indicate that the model is better suited for certain types of data or that specific types require further optimization for longer sequences. The fluctuating accuracy of Type 3 might be due to the inherent complexity or variability of that particular data type.