## Heatmap: Baseline - Short-to-Long - Qwen-2.5 7B
### Overview
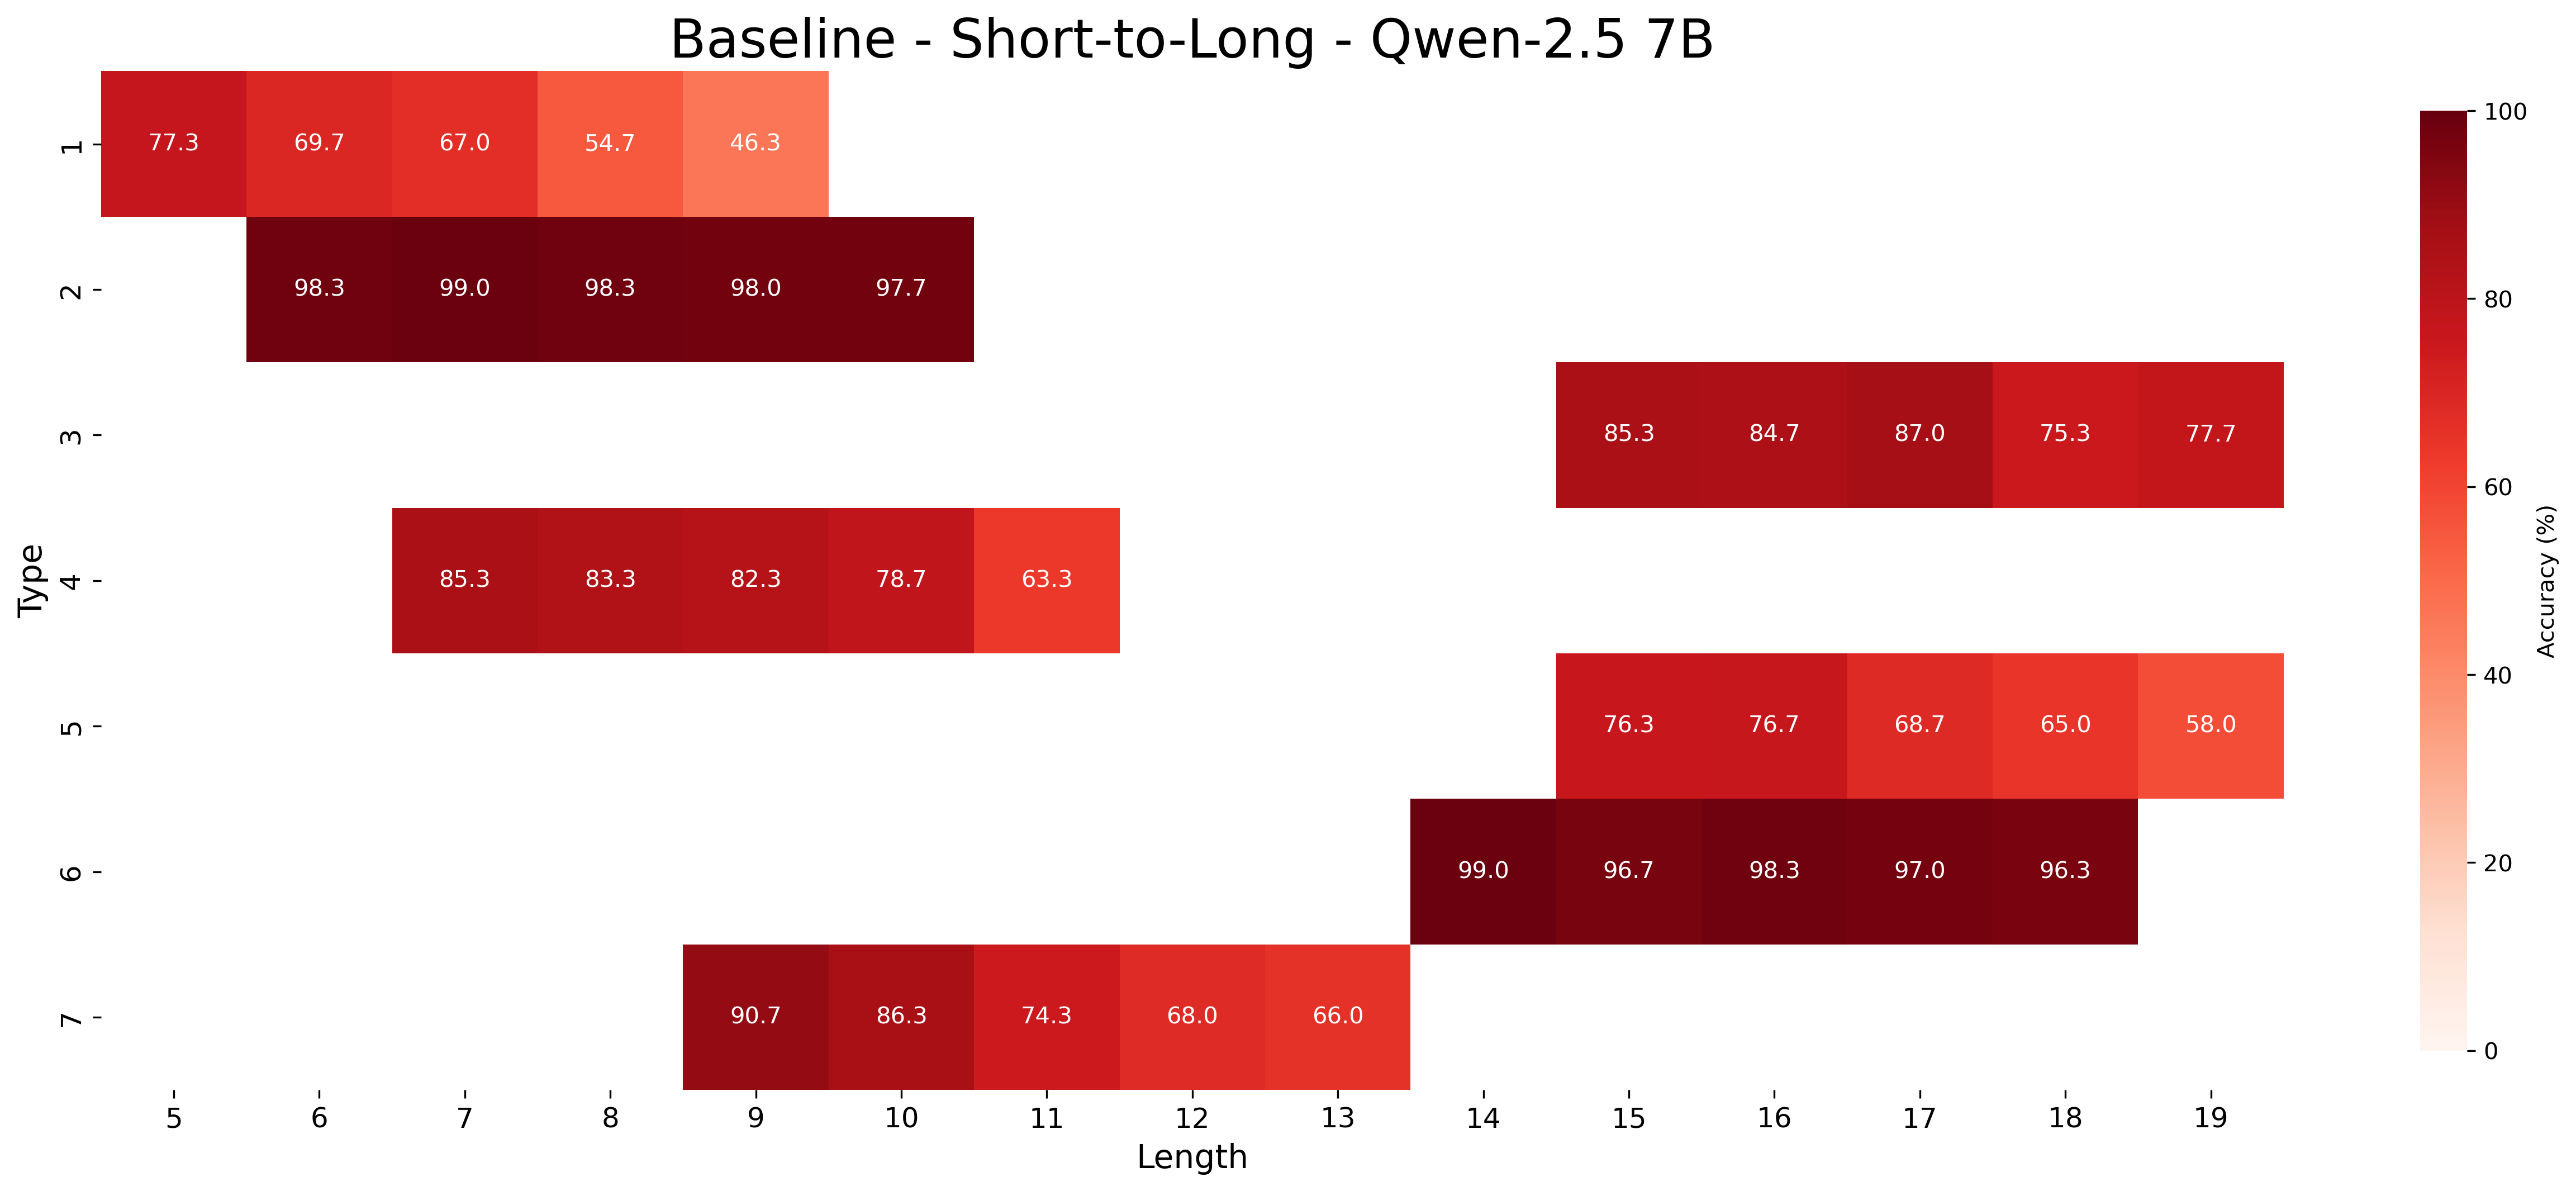
This image presents a heatmap visualizing the accuracy of a model (Qwen-2.5 7B) in a "Short-to-Long" task, categorized by "Type" and "Length". The heatmap uses a color gradient to represent accuracy values, ranging from approximately 0% to 100%.
### Components/Axes
* **Title:** Baseline - Short-to-Long - Qwen-2.5 7B (positioned at the top-center)
* **X-axis:** Length, ranging from 5 to 19, with markers at each integer value.
* **Y-axis:** Type, ranging from 1 to 7, with markers at each integer value.
* **Color Scale:** A vertical color bar on the right side represents Accuracy (%), ranging from 0% (lightest color) to 100% (darkest color).
* **Data Points:** Each cell in the heatmap represents the accuracy for a specific combination of Type and Length. The values are displayed within each cell.
### Detailed Analysis
The heatmap displays accuracy values for 7 Types and 15 Lengths. The color intensity corresponds to the accuracy percentage.
Here's a breakdown of the data, reading row by row (Type 1 to Type 7):
* **Type 1:** Accuracy decreases as Length increases. Values are approximately: 77.3% (Length 5), 69.7% (Length 6), 54.7% (Length 7), 46.3% (Length 8).
* **Type 2:** Very high accuracy across all lengths. Values are approximately: 98.3% (Length 5), 99.0% (Length 6), 98.3% (Length 7), 99.0% (Length 8), 97.7% (Length 9).
* **Type 3:** High accuracy, with a slight decrease towards Length 8. Values are approximately: 85.3% (Length 5), 84.7% (Length 6), 87.0% (Length 7), 75.3% (Length 8), 77.7% (Length 9).
* **Type 4:** Accuracy decreases as Length increases. Values are approximately: 85.3% (Length 5), 83.3% (Length 6), 82.3% (Length 7), 78.7% (Length 8), 63.3% (Length 9).
* **Type 5:** Accuracy decreases as Length increases. Values are approximately: 76.3% (Length 5), 68.7% (Length 6), 65.0% (Length 7), 58.0% (Length 8).
* **Type 6:** Very high accuracy across all lengths. Values are approximately: 99.0% (Length 5), 96.7% (Length 6), 97.0% (Length 7), 96.3% (Length 8).
* **Type 7:** Accuracy decreases as Length increases. Values are approximately: 90.7% (Length 5), 86.3% (Length 6), 74.3% (Length 7), 68.0% (Length 8), 66.0% (Length 9).
### Key Observations
* **Type 2 and Type 6** consistently exhibit the highest accuracy across all lengths, exceeding 96% in most cases.
* **Type 1, Type 4, Type 5, and Type 7** show a clear negative correlation between Length and Accuracy – as the length increases, the accuracy tends to decrease.
* The accuracy values are generally high, with most cells displaying values above 60%.
* There is a noticeable pattern of decreasing accuracy for longer lengths, particularly for Types 1, 4, 5, and 7.
### Interpretation
The heatmap demonstrates the performance of the Qwen-2.5 7B model on a "Short-to-Long" task, categorized by Type and Length. The model performs exceptionally well on Types 2 and 6, suggesting it is well-suited for those specific types of tasks. However, its performance degrades as the length of the input increases for Types 1, 4, 5, and 7. This could indicate that the model struggles with longer sequences or that the task becomes more challenging with increased length for these types.
The consistent high accuracy for Types 2 and 6 might suggest these types are simpler or more aligned with the model's training data. The decreasing accuracy with length for other types could be due to issues with long-range dependencies or the model's ability to maintain context over longer sequences. Further investigation would be needed to understand the specific characteristics of each type and the reasons for the observed performance differences.