# Technical Document Extraction: Heatmap Analysis
## Title
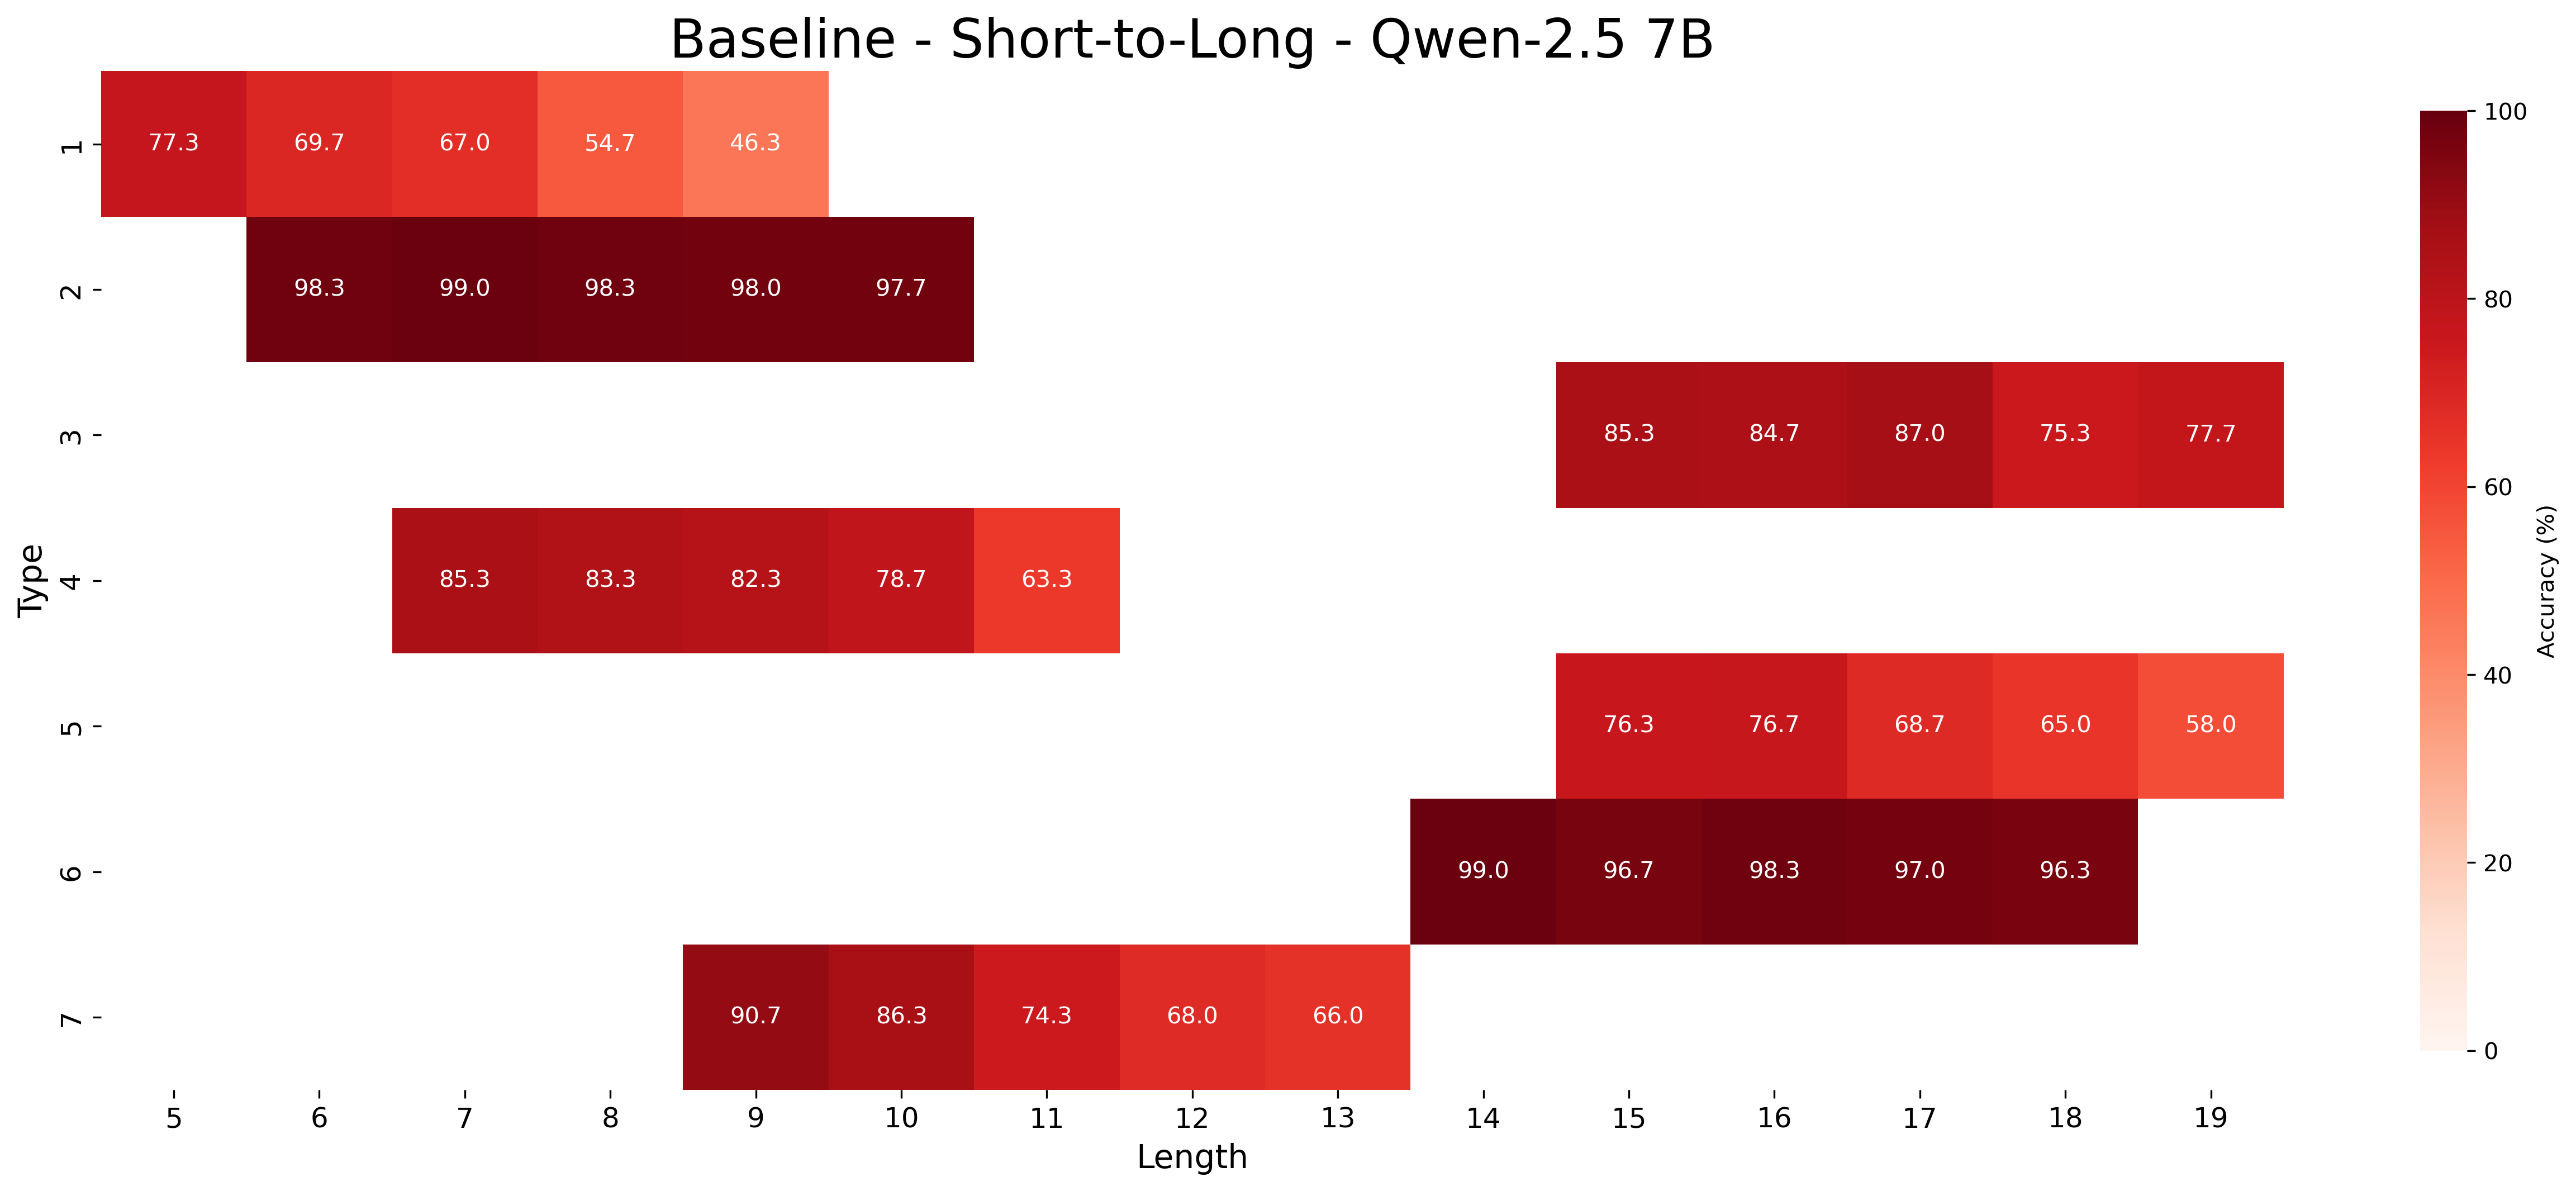
**Baseline - Short-to-Long - Qwen-2.5 7B**
---
## Axes and Labels
- **X-Axis (Horizontal):**
- Label: `Length`
- Values: `5` to `19` (inclusive)
- **Y-Axis (Vertical):**
- Label: `Type`
- Values: `1` to `7` (inclusive)
- **Colorbar (Right):**
- Label: `Accuracy (%)`
- Range: `0%` (light orange) to `100%` (dark red)
---
## Data Structure
The heatmap represents **accuracy percentages** for different `Type` (rows) and `Length` (columns). Each cell contains a numerical value corresponding to accuracy.
### Key Observations:
1. **Color Gradient:**
- Light orange → Dark red (low → high accuracy).
- Example: `77.3%` (Type 1, Length 5) is dark red; `46.3%` (Type 1, Length 8) is light orange.
2. **Trends:**
- **Type 1:** Accuracy decreases sharply from `77.3%` (Length 5) to `46.3%` (Length 8).
- **Type 2:** Consistently high accuracy (`98.3%` to `97.7%`) across Lengths 6–10.
- **Type 3:** Starts at `85.3%` (Length 15) and declines to `77.7%` (Length 19).
- **Type 4:** Peaks at `85.3%` (Length 7) and drops to `63.3%` (Length 12).
- **Type 5:** Declines from `76.3%` (Length 15) to `58.0%` (Length 19).
- **Type 6:** High accuracy (`99.0%` to `96.3%`) across Lengths 14–18.
- **Type 7:** Declines from `90.7%` (Length 9) to `66.0%` (Length 13).
---
## Legend and Spatial Grounding
- **Legend Placement:** Right side of the heatmap.
- **Color Consistency:**
- Dark red cells (e.g., Type 2, Length 6: `98.3%`) align with the top of the colorbar.
- Light orange cells (e.g., Type 1, Length 8: `46.3%`) align with the bottom of the colorbar.
---
## Data Table Reconstruction
| Type \ Length | 5 | 6 | 7 | 8 | 9 | 10 | 11 | 12 | 13 | 14 | 15 | 16 | 17 | 18 | 19 |
|---------------|-------|-------|-------|-------|-------|-------|-------|-------|-------|-------|-------|-------|-------|-------|-------|
| 1 | 77.3 | 69.7 | 67.0 | 54.7 | 46.3 | | | | | | | | | | |
| 2 | | 98.3 | 99.0 | 98.3 | 98.0 | 97.7 | | | | | | | | | |
| 3 | | | | | | | | | | | 85.3 | 84.7 | 87.0 | 75.3 | 77.7 |
| 4 | | | | | 85.3 | 83.3 | 82.3 | 78.7 | 63.3 | | | | | | |
| 5 | | | | | | | | | | | 76.3 | 76.7 | 68.7 | 65.0 | 58.0 |
| 6 | | | | | | | | | | | | | 99.0 | 96.7 | 98.3 | 97.0 | 96.3 |
| 7 | | | | | 90.7 | 86.3 | 74.3 | 68.0 | 66.0 | | | | | | |
---
## Notes
- Missing values (e.g., Type 1, Lengths 9–19) are represented by empty cells.
- Accuracy percentages are explicitly labeled in each cell.
- No additional text or legends are present outside the described components.