## Heatmaps: Three 2D Heatmaps with Shared Color Scale
### Overview
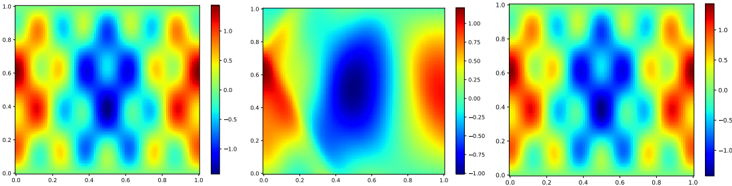
The image presents three separate 2D heatmaps arranged horizontally. Each heatmap displays a spatial distribution of values, represented by a color gradient. All three heatmaps share the same color scale, which is displayed vertically to the right of the first and third heatmaps. The x and y axes of each heatmap range from 0.0 to 1.0.
### Components/Axes
* **X-axis:** Ranges from 0.0 to 1.0 in increments of 0.2.
* **Y-axis:** Ranges from 0.0 to 1.0 in increments of 0.2.
* **Color Scale:** A vertical color bar located to the right of the first and third heatmaps. The color scale ranges from -1.0 (dark blue) to 1.0 (dark red), with intermediate values represented by a gradient of colors (blue, cyan, green, yellow, red). The color scale has markers at -1.0, -0.75, -0.5, -0.25, 0.0, 0.25, 0.5, 0.75, and 1.0.
### Detailed Analysis
**Heatmap 1 (Left):**
* A central vertical region of low values (blue) is flanked by regions of higher values (yellow/red).
* There are repeating patterns of high and low values along both the x and y axes.
* The lowest values (dark blue, approximately -1.0) are concentrated in the center.
* The highest values (red, approximately 1.0) are located on the left and right edges, near the top and bottom.
**Heatmap 2 (Center):**
* A large central region of low values (dark blue, approximately -1.0) dominates the heatmap.
* The values increase gradually towards the edges, transitioning from blue to cyan, green, yellow, and finally red at the corners.
* The highest values (red, approximately 1.0) are located in the top-left and bottom-right corners.
**Heatmap 3 (Right):**
* This heatmap has a similar pattern to Heatmap 1, with a central vertical region of low values (blue) and flanking regions of higher values (yellow/red).
* The lowest values (dark blue, approximately -1.0) are concentrated in the center.
* The highest values (red, approximately 1.0) are located on the left and right edges, near the top and bottom.
### Key Observations
* All three heatmaps share the same x and y axis scales and the same color scale.
* Heatmaps 1 and 3 exhibit similar patterns, while Heatmap 2 has a distinct central region of low values.
* The color scale provides a direct mapping between color and value, allowing for quantitative interpretation of the heatmaps.
### Interpretation
The three heatmaps likely represent different spatial distributions of a variable, with the color indicating the magnitude of the variable at each location. The similarity between Heatmaps 1 and 3 suggests that they may represent similar phenomena or be generated by similar processes. Heatmap 2, with its central low-value region, likely represents a different phenomenon or a different state of the same phenomenon. The shared color scale allows for direct comparison of the magnitudes of the variable across the three heatmaps. The data suggests that the variable being visualized has both positive and negative values, ranging from approximately -1.0 to 1.0. The spatial patterns in the heatmaps could be indicative of underlying physical processes, such as diffusion, convection, or wave propagation.