## Heatmaps: Comparative Analysis of Three Data Distributions
### Overview
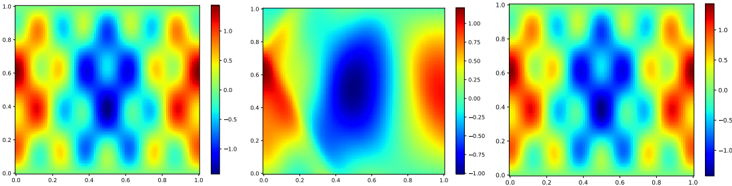
The image displays three side-by-side heatmaps representing spatial distributions of numerical values. Each heatmap uses a color gradient from red (high positive values) to blue (negative values), with green/yellow as transitional zones. The middle heatmap shows a distinct central anomaly, while the left and right heatmaps exhibit symmetrical patterns.
### Components/Axes
- **Axes**:
- X-axis: Labeled 0.0 to 1.0 (left to right)
- Y-axis: Labeled 0.0 to 1.0 (bottom to top)
- **Legends**:
- Left/Right Heatmaps: Scale from -1.0 (blue) to 1.0 (red)
- Middle Heatmap: Scale from -0.75 (blue) to 0.75 (red)
- **Positioning**:
- Legends are aligned to the right of each heatmap
- Axes labels are positioned at the bottom (X) and left (Y) edges
### Detailed Analysis
1. **Left Heatmap**:
- Symmetrical distribution with alternating red/blue regions
- Central region shows a dark blue trough (-1.0) surrounded by red peaks
- Outer regions exhibit diminishing intensity (yellow/green gradients)
2. **Middle Heatmap**:
- Dominated by a large central dark blue region (-0.75)
- Surrounded by concentric rings of red/orange (0.75) and green/yellow
- Peripheral areas show minimal variation (light green)
3. **Right Heatmap**:
- Mirror image of the left heatmap with identical symmetry
- Central trough (-1.0) and peripheral red peaks
- Color intensity matches left heatmap but with slightly sharper transitions
### Key Observations
- **Symmetry**: Left and right heatmaps exhibit perfect bilateral symmetry
- **Anomaly**: Middle heatmap contains a localized -0.75 value at (0.5, 0.5)
- **Scale Differences**: Middle heatmap uses a compressed range (-0.75 to 0.75) vs ±1.0 for others
- **Color Consistency**: Red/blue polarity matches across all heatmaps
### Interpretation
The data suggests three distinct phenomena:
1. **Mirrored Systems**: Left/right heatmaps likely represent balanced, opposing forces (e.g., electrical potentials, fluid dynamics)
2. **Central Disruption**: Middle heatmap's central anomaly could indicate a focal event (e.g., pressure drop, signal interference)
3. **Normalization**: Different scales imply either:
- Different measurement units
- Data normalization for comparative analysis
- Variable sensitivity ranges
The symmetrical patterns in left/right heatmaps suggest controlled experimental conditions, while the middle heatmap's anomaly might represent an uncontrolled variable or measurement artifact. The compressed scale in the middle heatmap could indicate either higher precision requirements or data compression for visualization purposes.