## Line Chart: NMSE (dB) vs Frequency Across Different Rooms
### Overview
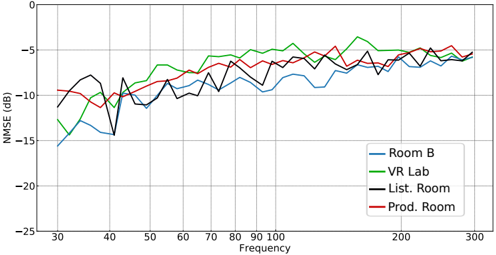
The chart displays the Normalized Mean Squared Error (NMSE) in decibels (dB) across a frequency range of 30–300 Hz for four distinct environments: Room B, VR Lab, List. Room, and Prod. Room. All lines exhibit fluctuating trends, with convergence toward -5 dB at higher frequencies. The VR Lab line shows the most pronounced variability, including a sharp dip below -15 dB near 40 Hz.
### Components/Axes
- **X-axis (Frequency)**: Labeled "Frequency" with markers at 30, 40, 50, ..., 300 Hz.
- **Y-axis (NMSE)**: Labeled "NMSE (dB)" with markers from 0 to -25 dB.
- **Legend**: Located in the bottom-right corner, associating colors with rooms:
- Blue: Room B
- Green: VR Lab
- Black: List. Room
- Red: Prod. Room
### Detailed Analysis
1. **Room B (Blue)**:
- Starts at ~-15 dB at 30 Hz, rises sharply to ~-5 dB by 50 Hz, then stabilizes with minor fluctuations.
- Ends near -5 dB at 300 Hz.
2. **VR Lab (Green)**:
- Begins at ~-10 dB, dips to ~-18 dB at 40 Hz, then oscillates upward to ~-5 dB by 100 Hz.
- Shows the highest variability, with peaks reaching ~-5 dB and troughs near -18 dB.
3. **List. Room (Black)**:
- Starts at ~-10 dB, fluctuates between -10 dB and -15 dB until 70 Hz, then stabilizes near -5 dB.
- Ends at ~-5 dB with minor oscillations.
4. **Prod. Room (Red)**:
- Begins at ~-10 dB, rises to ~-5 dB by 60 Hz, then fluctuates between -5 dB and -10 dB.
- Ends near -5 dB with consistent oscillations.
### Key Observations
- **Convergence at High Frequencies**: All lines approach -5 dB by 200–300 Hz, suggesting similar performance in higher-frequency ranges.
- **VR Lab Anomaly**: The sharp dip below -15 dB at 40 Hz is unique to VR Lab, indicating a potential outlier or environmental factor.
- **Initial Variability**: Room B and VR Lab start with the lowest NMSE values, while List. Room and Prod. Room begin higher but converge later.
### Interpretation
The data suggests that NMSE values (lower = better accuracy) are frequency-dependent and environment-specific. The convergence at higher frequencies implies that measurement accuracy stabilizes across rooms in this range. The VR Lab’s anomalous dip at 40 Hz may reflect unique acoustic properties or calibration issues in that environment. Room B’s rapid improvement from 30–50 Hz contrasts with its stability at higher frequencies, possibly indicating targeted adjustments in that range. The consistency of List. Room and Prod. Room at higher frequencies suggests they may share similar acoustic characteristics or calibration standards.