## Heatmap: Parameter Importance Across Layers
### Overview
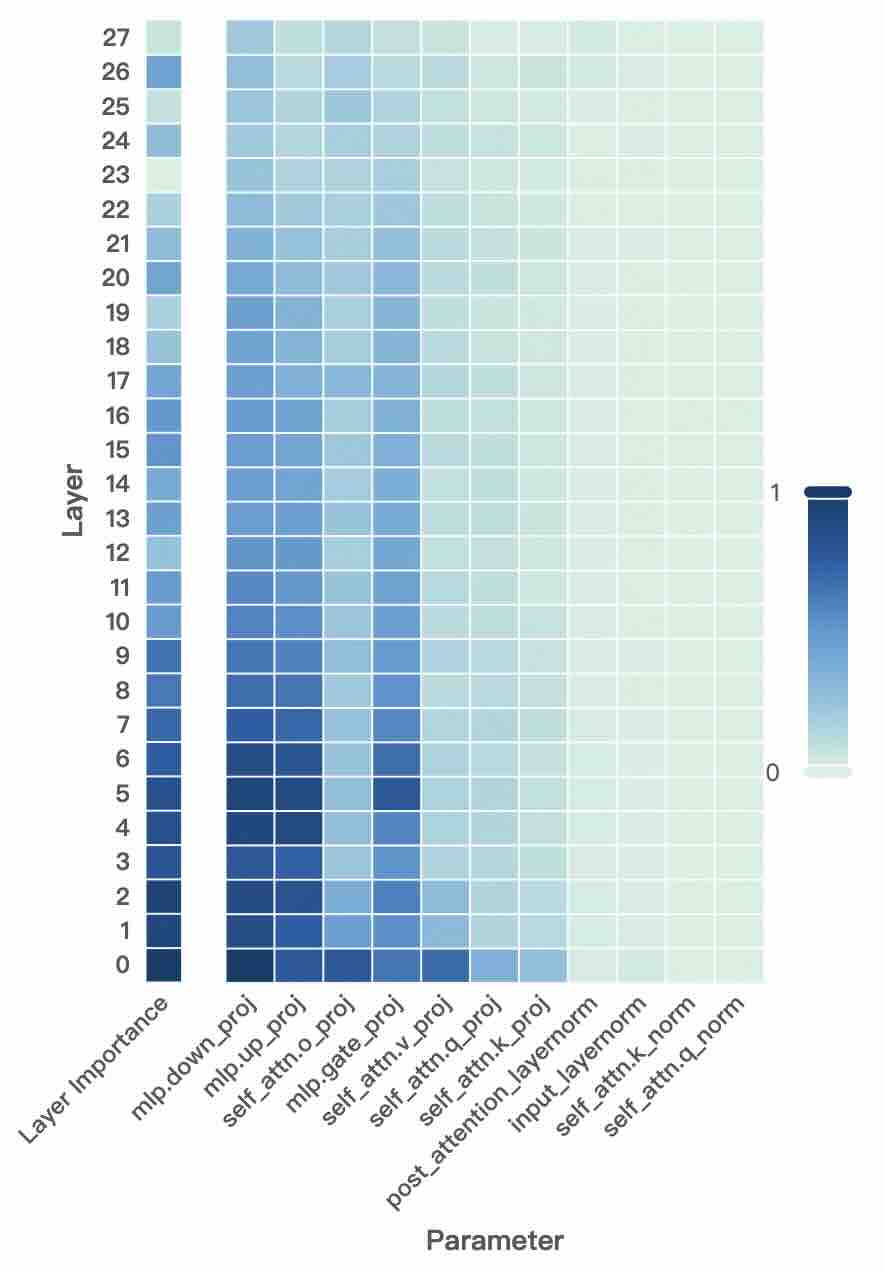
The image is a heatmap visualizing the importance or magnitude of various parameters across 28 layers (0–27) of a neural network. The x-axis lists parameters like `mlp.down_proj`, `mlp.up_proj`, `self_attn.q_proj`, etc., while the y-axis represents layers. The color scale (0–1) indicates parameter values, with darker blue representing higher values.
### Components/Axes
- **Y-axis (Layer)**: Labeled "Layer" with values 0 (bottom) to 27 (top).
- **X-axis (Parameter)**: Labeled "Parameter" with categories:
`mlp.down_proj`, `mlp.up_proj`, `mlp.attn.o_proj`, `mlp.gate_proj`, `mlp.attn.v_proj`, `mlp.attn.q_proj`, `mlp.attn.k_proj`, `post_attention_layernorm`, `input_layernorm`, `self_attn.k_norm`, `self_attn.q_norm`.
- **Color Scale**: Vertical bar on the right, ranging from 0 (lightest, white) to 1 (darkest, navy blue).
### Detailed Analysis
- **Layer 0–5**:
- Darkest cells (values ~0.8–1.0) in `mlp.down_proj`, `mlp.up_proj`, and `mlp.attn.q_proj`.
- Moderate values (~0.4–0.6) in `mlp.attn.k_proj` and `mlp.gate_proj`.
- **Layer 6–15**:
- Gradual decrease in intensity. `mlp.down_proj` and `mlp.up_proj` remain moderately dark (~0.5–0.7).
- `mlp.attn.q_proj` and `mlp.attn.k_proj` show lighter values (~0.3–0.5).
- **Layer 16–27**:
- Most cells are light (values ~0.1–0.3), except occasional darker cells in `mlp.down_proj` (~0.4–0.5) and `mlp.up_proj` (~0.3–0.4).
### Key Observations
1. **Early Layers Dominance**: Parameters like `mlp.down_proj` and `mlp.up_proj` exhibit the highest values in the first 5 layers, suggesting critical roles in early processing.
2. **Gradual Decay**: Parameter importance diminishes as layers increase, with later layers showing uniformly lighter values.
3. **Projection Layers**: `mlp.down_proj` and `mlp.up_proj` consistently show higher values across all layers compared to other parameters.
4. **Normalization Layers**: `post_attention_layernorm`, `input_layernorm`, and `self_attn.k_norm`/`q_norm` have uniformly low values (~0.1–0.2), indicating minimal impact.
### Interpretation
The heatmap reveals that early layers (0–5) are dominated by parameters related to down/up projections (`mlp.down_proj`, `mlp.up_proj`), which likely drive feature extraction and transformation. The gradual decline in intensity across layers suggests diminishing returns or stabilization of parameter importance in deeper layers. The consistently low values for normalization layers (`post_attention_layernorm`, `input_layernorm`) imply their role is secondary to the core projection and attention mechanisms. This pattern aligns with typical transformer architectures, where early layers handle feature learning, and later layers refine representations.
**Note**: Values are approximate due to the absence of explicit numerical labels on the heatmap cells. The color gradient provides relative, not absolute, quantification.