## Diagram: Probabilistic Graphical Model Representation
### Overview
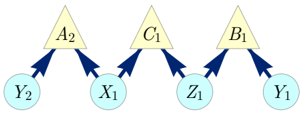
The image depicts a directed acyclic graph (DAG) representing relationships between several variables. The diagram consists of two types of nodes: triangles and circles, connected by directed arrows. The triangles appear to represent latent or parent variables, while the circles represent observed or child variables. The arrows indicate a directional influence or dependency.
### Components/Axes
* **Node Types:**
* **Triangles:** Yellow triangles containing labels. These are positioned above the circles.
* `A₂` (Leftmost triangle)
* `C₁` (Center triangle)
* `B₁` (Rightmost triangle)
* **Circles:** Light blue circles containing labels. These are positioned below the triangles.
* `Y₂` (Leftmost circle)
* `X₁` (Second from left circle)
* `Z₁` (Third from left circle)
* `Y₁` (Rightmost circle)
* **Arrows:** Dark blue arrows with arrowheads. These indicate the direction of influence.
### Detailed Analysis
The diagram illustrates the following dependencies:
1. **Variable `A₂`:**
* Receives input from `Y₂` (arrow from `Y₂` to `A₂`).
* Receives input from `X₁` (arrow from `X₁` to `A₂`).
2. **Variable `C₁`:**
* Receives input from `X₁` (arrow from `X₁` to `C₁`).
* Receives input from `Z₁` (arrow from `Z₁` to `C₁`).
3. **Variable `B₁`:**
* Receives input from `Z₁` (arrow from `Z₁` to `B₁`).
* Receives input from `Y₁` (arrow from `Y₁` to `B₁`).
The arrangement suggests a structure where variables `Y₂`, `X₁`, `Z₁`, and `Y₁` are observed variables, and `A₂`, `C₁`, and `B₁` are latent variables that are influenced by these observed variables. The diagram does not contain any numerical data, scales, or legends beyond the labels within the nodes.
### Key Observations
* The variable `X₁` influences both `A₂` and `C₁`.
* The variable `Z₁` influences both `C₁` and `B₁`.
* The variables `Y₂` and `Y₁` are unique inputs to `A₂` and `B₁` respectively.
* The structure is a directed acyclic graph, implying no circular dependencies.
### Interpretation
This diagram likely represents a simplified probabilistic graphical model, such as a Bayesian network or a factor graph, used in machine learning or statistical modeling.
* **What the data suggests or demonstrates:** The diagram demonstrates a specific dependency structure between a set of observed variables (`Y₂`, `X₁`, `Z₁`, `Y₁`) and a set of latent variables (`A₂`, `C₁`, `B₁`). The arrows indicate that the latent variables are conditionally dependent on the observed variables. For instance, the probability distribution of `A₂` would be influenced by the values of `Y₂` and `X₁`.
* **How the elements relate to each other:** The structure suggests a hierarchical or compositional model. The observed variables act as inputs or features that contribute to the formation or state of the latent variables. The latent variables, in turn, might be further processed or represent higher-level concepts. The shared influences of `X₁` and `Z₁` suggest these observed variables play a role in multiple latent constructs.
* **Any notable outliers, trends, or anomalies:** There are no numerical data points or trends to analyze for outliers. The structure itself is the primary information. The diagram is symmetrical in its representation of inputs to the latent variables, with each latent variable receiving exactly two inputs from the observed variables. The labels `A₂`, `C₁`, `B₁` and `Y₂`, `X₁`, `Z₁`, `Y₁` suggest these might be instances of different types of variables or features, with the subscripts potentially indicating dimensionality or specific indices. For example, `Y₂` and `Y₁` might be two instances of a variable type 'Y'.