## Diagram: Hierarchical Dependency Network
### Overview
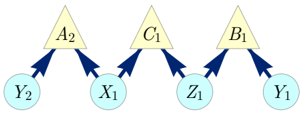
The image displays a directed graph diagram illustrating hierarchical relationships between two sets of nodes. The structure consists of three upper-level nodes (triangles) and four lower-level nodes (circles), with directed arrows indicating influence or dependency flow from the upper to the lower level.
### Components/Axes
**Upper-Level Nodes (Triangles):**
- **Position:** Arranged horizontally across the top of the diagram.
- **Shape & Color:** Light yellow triangles with black outlines.
- **Labels (Left to Right):**
1. `A₂` (A with subscript 2)
2. `C₁` (C with subscript 1)
3. `B₁` (B with subscript 1)
**Lower-Level Nodes (Circles):**
- **Position:** Arranged horizontally across the bottom of the diagram.
- **Shape & Color:** Light blue circles with black outlines.
- **Labels (Left to Right):**
1. `Y₂` (Y with subscript 2)
2. `X₁` (X with subscript 1)
3. `Z₁` (Z with subscript 1)
4. `Y₁` (Y with subscript 1)
**Connections (Arrows):**
- **Style:** Solid, dark blue arrows with arrowheads pointing downward.
- **Flow Direction:** From each upper-level triangle to specific lower-level circles.
### Detailed Analysis
**Connection Mapping:**
1. **From Triangle `A₂`:**
- Arrow 1 points to Circle `Y₂`.
- Arrow 2 points to Circle `X₁`.
2. **From Triangle `C₁`:**
- Arrow 1 points to Circle `X₁`.
- Arrow 2 points to Circle `Z₁`.
3. **From Triangle `B₁`:**
- Arrow 1 points to Circle `Z₁`.
- Arrow 2 points to Circle `Y₁`.
**Network Topology:**
- The diagram forms a bipartite graph between the set of triangles {A₂, C₁, B₁} and the set of circles {Y₂, X₁, Z₁, Y₁}.
- Circles `X₁` and `Z₁` are each connected to two triangles, indicating they are influenced by or dependent on multiple upper-level components.
- Circles `Y₂` and `Y₁` are each connected to only one triangle (`A₂` and `B₁`, respectively), indicating a single source of influence or dependency.
### Key Observations
1. **Shared Dependencies:** The central circles (`X₁` and `Z₁`) act as integration points. `X₁` is the convergence point for `A₂` and `C₁`. `Z₁` is the convergence point for `C₁` and `B₁`.
2. **Symmetry and Asymmetry:** The structure is symmetric in its connection pattern (each triangle connects to two circles, each circle connects to one or two triangles) but asymmetric in its labeling. The triangles use letters A, C, B (not alphabetical order) and subscripts 2, 1, 1. The circles use letters Y, X, Z, Y and subscripts 2, 1, 1, 1.
3. **Color Coding:** A consistent color scheme is used to differentiate node types: yellow for upper-level (triangles), blue for lower-level (circles), and dark blue for connections.
### Interpretation
This diagram models a system of dependencies or information flow. The triangles (`A₂`, `C₁`, `B₁`) likely represent higher-level processes, modules, or decision points. The circles (`Y₂`, `X₁`, `Z₁`, `Y₁`) represent lower-level outputs, data points, or sub-components.
The key insight is the **overlapping influence** on `X₁` and `Z₁`. This suggests these elements are critical integration nodes or shared resources within the system. Their state or output is determined by the combined input from two distinct higher-level sources. In contrast, `Y₂` and `Y₁` have dedicated, single-source dependencies, making them more isolated or specialized components.
The labeling with subscripts (e.g., `A₂` vs. `C₁`) may imply versioning, iteration, or different instances of a base type (A, B, C, X, Y, Z). The non-alphabetical order of the triangles (A, C, B) could indicate a specific sequence or priority that is not strictly alphabetical. Without additional context, the exact nature of the relationships (e.g., data flow, control flow, inheritance) remains abstract, but the structural pattern of shared vs. dedicated dependencies is clearly communicated.