## Flowchart Diagram: Decision Process with Multiple Outcomes
### Overview
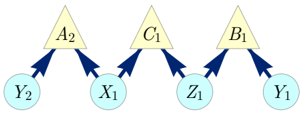
The image depicts a flowchart with three decision nodes (triangles) and four outcome nodes (circles). Arrows indicate directional relationships between nodes, suggesting a process flow from decisions to outcomes. The diagram uses color coding: yellow for decision nodes and light blue for outcome nodes.
### Components/Axes
- **Decision Nodes (Triangles)**:
- **A2**: Positioned at the top-left, connected via two arrows to outcome nodes.
- **C1**: Centered, connected via one arrow to an outcome node.
- **B1**: Top-right, connected via one arrow to an outcome node.
- **Outcome Nodes (Circles)**:
- **Y2**: Bottom-left, connected from A2.
- **X1**: Middle-left, connected from A2.
- **Z1**: Middle-right, connected from C1.
- **Y1**: Bottom-right, connected from B1.
- **Arrows**: Dark blue, indicating flow direction. No legends or axis titles are present.
### Detailed Analysis
- **Node Connections**:
- **A2** → **Y2** (leftward arrow) and **A2** → **X1** (rightward arrow).
- **C1** → **Z1** (rightward arrow).
- **B1** → **Y1** (rightward arrow).
- **Spatial Layout**:
- Decision nodes are arranged horizontally at the top.
- Outcome nodes are positioned below their respective decision nodes, with **Y2** and **X1** aligned left, **Z1** centered, and **Y1** right.
### Key Observations
1. **Branching Structure**: **A2** splits into two outcomes (**Y2**, **X1**), while **C1** and **B1** each lead to a single outcome.
2. **Repetition**: The outcome node **Y1** shares its label with **Y2**, suggesting potential equivalence or redundancy in outcomes.
3. **Simplicity**: No numerical values, scales, or additional annotations are present.
### Interpretation
This flowchart likely represents a decision tree or process model where:
- **A2** acts as a bifurcation point, leading to divergent outcomes (**Y2** and **X1**).
- **C1** and **B1** represent linear decision paths with singular results (**Z1** and **Y1**).
- The repetition of **Y1/Y2** may imply shared outcomes or a naming convention (e.g., "Y" as a category prefix).
The diagram emphasizes structural relationships over quantitative data, focusing on logical flow rather than measurable trends. No anomalies or outliers are evident due to the absence of numerical data.