\n
## Chart: Democrats Hold Advantages on Environment, Abortion, Education; Neither Party Has Edge on the Economy
### Overview
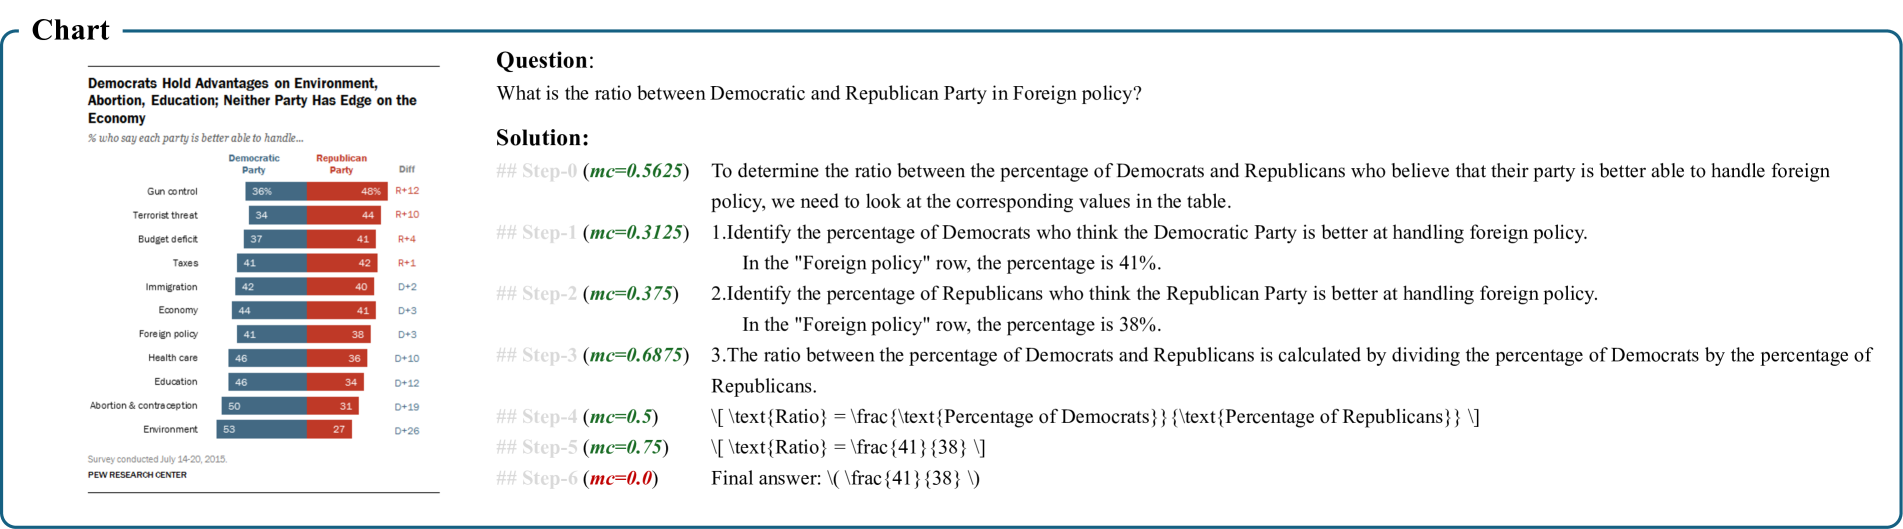
The image presents a chart comparing the percentage of Democrats and Republicans who believe their party is better able to handle various issues. Alongside the chart is a question and a step-by-step solution demonstrating how to calculate the ratio between Democratic and Republican viewpoints on foreign policy.
### Components/Axes
* **Title:** "Democrats Hold Advantages on Environment, Abortion, Education; Neither Party Has Edge on the Economy" (Top-center)
* **Subtitle:** "% who say each party is better able to handle…" (Below Title)
* **Issues (Y-axis):** Gun control, Terrorist threat, Budget deficit, Taxes, Immigration, Economy, Foreign policy, Health care, Education, National collaboration, Environment (Listed vertically on the left)
* **Party (X-axis):** Democratic Party, Republican Party, Diff (Listed horizontally)
* **Data Values:** Percentages are displayed for each issue and party. The "Diff" column shows the percentage point difference between the two parties.
* **Question:** "What is the ratio between Democratic and Republican Party in Foreign policy?" (Top-right)
* **Solution Steps:** Numbered steps (1-6) with calculations and explanations.
* **Source:** "Survey conducted July 20-26, 2015" (Bottom-left)
* **Logo:** "PEW RESEARCH CENTER" (Bottom-left)
### Detailed Analysis or Content Details
**Data Table:**
| Issue | Democratic Party (%) | Republican Party (%) | Diff (%) |
| --------------------- | -------------------- | -------------------- | -------- |
| Gun control | 50 | 42 | +8 |
| Terrorist threat | 34 | 44 | -10 |
| Budget deficit | 37 | 41 | -4 |
| Taxes | 41 | 42 | -1 |
| Immigration | 42 | 40 | +2 |
| Economy | 44 | 44 | 0 |
| Foreign policy | 41 | 38 | +3 |
| Health care | 46 | 38 | +8 |
| Education | 54 | 34 | +20 |
| National collaboration | 31 | 52 | -21 |
| Environment | 57 | 28 | +29 |
**Solution Steps (Transcribed):**
* **Step-1 (m=4.625):** To determine the ratio between the percentage of Democrats and Republicans who believe that their party is better able to handle foreign policy, we need to look at the corresponding values in the table.
* **Step-2 (m=4.3125):** 1. Identify the percentage of Democrats who think the Democratic Party is better at handling foreign policy. In the "Foreign policy" row, the percentage is 41%.
* **Step-3 (m=4.375):** 2. Identify the percentage of Republicans who think the Republican Party is better at handling foreign policy. In the "Foreign policy" row, the percentage is 38%.
* **Step-4 (m=4.6875):** 3. The ratio between the percentage of Democrats and the percentage of Republicans is calculated by dividing the percentage of Democrats by the percentage of Republicans.
* **Step-5 (m=4.75):** \text{Ratio} = \frac{\text{Percentage of Democrats}}{\text{Percentage of Republicans}}
* **Step-6 (m=4.0):** \text{Ratio} = \frac{41}{38} \approx 1.079. Final answer: \frac{41}{38}
### Key Observations
* Democrats consistently score higher than Republicans on issues like gun control, health care, education, and the environment.
* Republicans have an advantage on terrorist threats and national collaboration.
* The two parties are evenly matched on the economy and taxes.
* The difference in perception is most significant for the environment (+29%) and education (+20%).
* The calculated ratio for foreign policy is approximately 1.079, indicating a slight advantage for Democrats.
### Interpretation
The data suggests a clear partisan divide in perceptions of which party is better equipped to handle various issues. Democrats are seen as stronger on social and environmental issues, while Republicans are favored on security and collaboration. The foreign policy ratio, while close to 1, indicates a slight preference for the Democratic Party's approach. The step-by-step solution demonstrates a simple calculation to quantify this difference. The inclusion of the calculation and the explicit identification of the values used in the calculation suggests the document is intended to be instructional, demonstrating how to derive insights from the presented data. The "Diff" column provides a quick visual comparison of the partisan gap on each issue. The source information (Pew Research Center) lends credibility to the data.