## Diagram: Object Relationship and Property Graph
### Overview
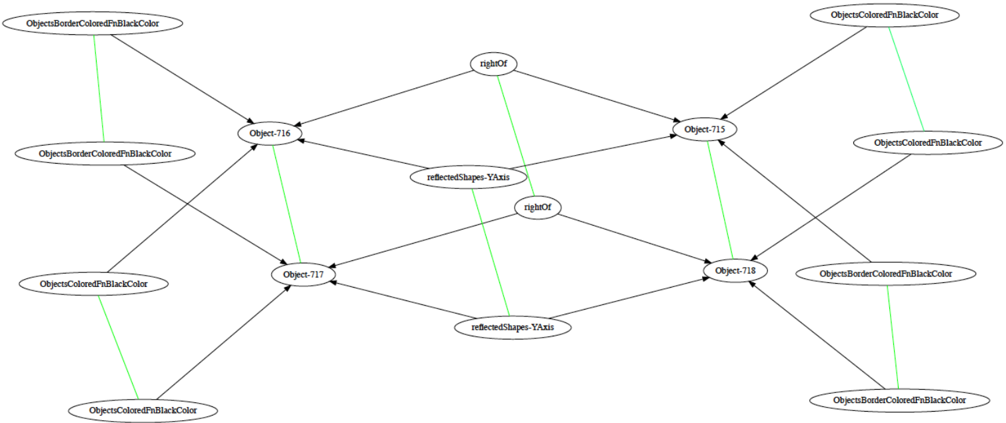
This image is a directed graph diagram representing a scene or data structure, likely from a computer vision or AI dataset (such as CLEVR). It maps specific object identifiers (Object-715 through Object-718) to their visual properties (color/border) and their spatial or geometric relationships to one another. The diagram exhibits high symmetry, with a left-to-right flow of information.
### Components/Axes
The diagram consists of nodes (ellipses) connected by two types of edges:
* **Black Arrows:** Represent directed relationships or logical flow.
* **Green Lines:** Represent associative or property-based links.
**Node Categories:**
* **Object Identifiers:** `Object-716`, `Object-717`, `Object-715`, `Object-718`.
* **Property Nodes:** `ObjectsBorderColoredFnBlackColor` and `ObjectsColoredFnBlackColor`.
* **Relationship Nodes:** `rightOf` and `reflectedShapes-YAxis`.
### Detailed Analysis
The diagram is organized into three vertical clusters: Left (Input/Properties), Center (Relationships), and Right (Output/Properties).
#### 1. Left Cluster (Properties to Objects)
* **Top-Left:** `ObjectsBorderColoredFnBlackColor` (connected via green line to `Object-716`).
* **Second-Left:** `ObjectsBorderColoredFnBlackColor` (connected via black arrow to `Object-716`).
* **Third-Left:** `ObjectsColoredFnBlackColor` (connected via black arrow to `Object-717`).
* **Bottom-Left:** `ObjectsColoredFnBlackColor` (connected via green line to `Object-717`).
#### 2. Center Cluster (Object Relationships)
* **Object-716 (Top-Left-Center):**
* Receives input from the left cluster.
* Connects via black arrow to `rightOf` (top-center).
* Connects via black arrow to `reflectedShapes-YAxis` (middle-center).
* **Object-717 (Bottom-Left-Center):**
* Receives input from the left cluster.
* Connects via black arrow to `rightOf` (middle-center).
* Connects via black arrow to `reflectedShapes-YAxis` (bottom-center).
* **Relationship Nodes:**
* `rightOf` (top-center) connects to `Object-715` (black arrow) and `rightOf` (middle-center) (green line).
* `reflectedShapes-YAxis` (middle-center) connects to `Object-715` (black arrow) and `reflectedShapes-YAxis` (bottom-center) (green line).
* `rightOf` (middle-center) connects to `Object-718` (black arrow).
* `reflectedShapes-YAxis` (bottom-center) connects to `Object-718` (black arrow).
#### 3. Right Cluster (Objects to Properties)
* **Object-715 (Top-Right-Center):**
* Receives input from `rightOf` and `reflectedShapes-YAxis`.
* Connects via black arrow to `ObjectsColoredFnBlackColor` (top-right).
* Connects via green line to `ObjectsColoredFnBlackColor` (second-right).
* **Object-718 (Bottom-Right-Center):**
* Receives input from `rightOf` and `reflectedShapes-YAxis`.
* Connects via black arrow to `ObjectsBorderColoredFnBlackColor` (third-right).
* Connects via green line to `ObjectsBorderColoredFnBlackColor` (bottom-right).
### Key Observations
* **Symmetry:** The graph is perfectly symmetric. The left side defines properties for the first set of objects (716, 717), and the right side defines properties for the second set of objects (715, 718).
* **Transformation Logic:** The central nodes (`rightOf`, `reflectedShapes-YAxis`) act as a bridge. The diagram suggests that `Object-715` and `Object-718` are the result of applying spatial and geometric transformations to `Object-716` and `Object-717`.
* **Color Coding:** The use of green lines appears to denote a specific sub-property or secondary relationship (e.g., a specific type of border or color attribute) distinct from the primary directed flow indicated by the black arrows.
### Interpretation
This diagram represents a **Scene Graph** or a **Transformation Pipeline**. It demonstrates how an AI model or a database understands the relationship between objects in a visual scene.
Specifically, it suggests that `Object-715` and `Object-718` are derived from `Object-716` and `Object-717` through specific geometric operations:
1. **Spatial:** They are positioned to the "right of" the original objects.
2. **Geometric:** They are "reflected" across the Y-axis.
The labels `ObjectsBorderColoredFnBlackColor` and `ObjectsColoredFnBlackColor` indicate that the system is tracking specific visual attributes (likely a black border vs. a solid black color) for these objects. The diagram essentially encodes the logic: "If Object A has property X, and Object B is the Y-axis reflection of Object A, then Object B also has property Z."