## Directed Graph Diagram: Object Relationships and Properties
### Overview
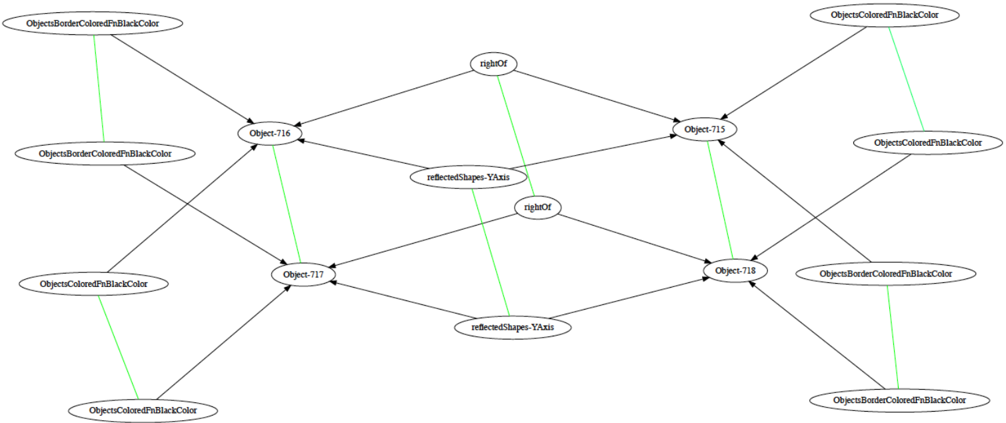
The image displays a directed graph diagram illustrating relationships between four central objects (Object-715, Object-716, Object-717, Object-718) and their associated color properties. The diagram uses nodes (ovals) and labeled, directional edges (arrows) to define spatial and reflective relationships. The layout is symmetrical, with property nodes flanking the central object nodes on the left and right sides.
### Components/Axes
* **Node Types:**
* **Object Nodes:** Four central nodes labeled `Object-715`, `Object-716`, `Object-717`, `Object-718`.
* **Property Nodes:** Eight peripheral nodes defining color attributes. They are of two types:
* `ObjectsBorderColoredPbBlackColor` (Appears 4 times)
* `ObjectsColoredPbBlackColor` (Appears 4 times)
* **Edge Labels (Relationships):**
* `rightOf`
* `reflectedShapes-YAxis`
* **Visual Encoding:**
* **Black Lines/Arrows:** Indicate primary relationships (`rightOf`, `reflectedShapes-YAxis`) and connections from property nodes to object nodes.
* **Green Lines:** Appear to specifically highlight the `reflectedShapes-YAxis` relationships between certain object pairs.
### Detailed Analysis
**1. Spatial Layout & Node Placement:**
* The four **Object Nodes** form a central diamond or square pattern.
* `Object-715` is in the upper-right quadrant.
* `Object-716` is in the upper-left quadrant.
* `Object-717` is in the lower-left quadrant.
* `Object-718` is in the lower-right quadrant.
* **Property Nodes** are positioned at the far left and right edges of the diagram, connected to the central objects.
* **Left Side (Top to Bottom):** `ObjectsBorderColoredPbBlackColor`, `ObjectsBorderColoredPbBlackColor`, `ObjectsColoredPbBlackColor`, `ObjectsColoredPbBlackColor`.
* **Right Side (Top to Bottom):** `ObjectsColoredPbBlackColor`, `ObjectsColoredPbBlackColor`, `ObjectsBorderColoredPbBlackColor`, `ObjectsBorderColoredPbBlackColor`.
**2. Relationship Mapping (Edge Analysis):**
* **`rightOf` Relationships:**
* An edge labeled `rightOf` points from `Object-716` to `Object-715`. **Interpretation:** Object-716 is to the right of Object-715.
* An edge labeled `rightOf` points from `Object-717` to `Object-718`. **Interpretation:** Object-717 is to the right of Object-718.
* **`reflectedShapes-YAxis` Relationships (Green Lines):**
* A green line connects `Object-716` and `Object-717`, with the label `reflectedShapes-YAxis` placed near the midpoint. **Interpretation:** Object-716 and Object-717 are reflections of each other across the Y-axis.
* A green line connects `Object-715` and `Object-718`, with the label `reflectedShapes-YAxis` placed near the midpoint. **Interpretation:** Object-715 and Object-718 are reflections of each other across the Y-axis.
* **Property Connections:**
* Each **Object Node** is connected to two **Property Nodes** (one of each type) via black arrows.
* **Example (Object-716):** Receives arrows from the top-left `ObjectsBorderColoredPbBlackColor` and the third-down-left `ObjectsColoredPbBlackColor`.
* This pattern is consistent for all four objects, indicating each object possesses both a border color and a fill color property defined as "PbBlackColor".
### Key Observations
1. **Symmetrical Structure:** The graph exhibits near-perfect bilateral symmetry across a vertical axis, reinforced by the explicit `reflectedShapes-YAxis` relationships.
2. **Property Consistency:** All objects share the same two property types (`BorderColored` and `Colored`) with the same value (`PbBlackColor`), suggesting a uniform style or class.
3. **Dual Relationship Types:** The diagram encodes two distinct kinds of information: absolute spatial positioning (`rightOf`) and symmetrical transformation (`reflectedShapes-YAxis`).
4. **Color Coding:** The use of green lines specifically for the reflection relationships provides a clear visual distinction from other connections.
### Interpretation
This diagram likely represents the underlying data structure or schema for a graphical composition or UI layout. It formally defines:
* **Identity:** Four distinct objects (715-718).
* **Appearance:** Each object has a black border and a black fill (`PbBlackColor`).
* **Spatial Logic:** The objects are arranged in a 2x2 grid where the left column (716, 717) is positioned to the right of the right column (715, 718) – note the `rightOf` direction is from left object to right object.
* **Symmetry Constraint:** The top and bottom rows are not independent; they are explicitly defined as vertical reflections of each other. This is a powerful constraint that ensures visual balance and reduces the independent parameters needed to define the layout.
The graph serves as a machine-readable or formal specification that guarantees a specific, symmetrical visual outcome. The repetition of "PbBlackColor" might indicate a placeholder, a default theme, or a specific color token in a design system. The "reflectedShapes" relationship is particularly significant, as it moves beyond simple positioning to encode a design *rule* (symmetry) directly into the data model.