TECHNICAL ASSET FINGERPRINT
8a796e4544f8384c1388e346
Click to view fullscreen
Press ESC or click to close
FOUND IN PAPERS
EXPERT: gemini-2.0-flash VERSION 1
RUNTIME: nugit/gemini/gemini-2.0-flash
INTEL_VERIFIED
## Chart: Masked Threshold vs. Delay Time
### Overview
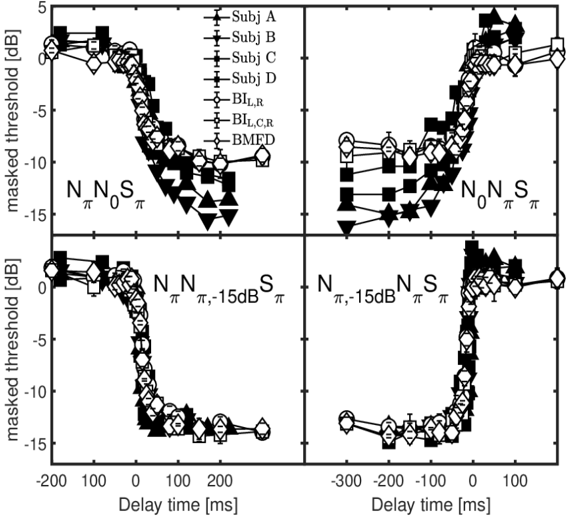
The image presents four line graphs showing the relationship between masked threshold (in dB) and delay time (in ms) under different conditions. The graphs are arranged in a 2x2 grid. Each graph displays data for multiple subjects and conditions, indicated by different line styles and markers.
### Components/Axes
* **Y-axis (masked threshold [dB])**: The vertical axis represents the masked threshold in decibels (dB). The scale ranges from -15 dB to 5 dB, with tick marks at -10 dB, -5 dB, and 0 dB.
* **X-axis (Delay time [ms])**: The horizontal axis represents the delay time in milliseconds (ms). The range varies slightly between the top and bottom rows.
* Top row: -200 ms to 200 ms, with a tick mark at 0 ms and 100 ms.
* Bottom row: -300 ms to 100 ms, with tick marks at -200 ms, -100 ms, and 0 ms.
* **Legend (Top-Right)**: Located in the top-right corner of the top-left subplot.
* Subj A (Subject A): Black line with square markers.
* Subj B (Subject B): Black line with circle markers.
* Subj C (Subject C): Black line with diamond markers.
* Subj D (Subject D): Black line with triangle markers.
* BI<sub>L,R</sub>: Black line with plus markers.
* BI<sub>L,C,R</sub>: Black line with horizontal bar markers.
* BMFD: Black line with open circle markers.
* **Titles**: Each subplot has a title indicating the condition:
* Top-left: N<sub>π</sub>N<sub>0</sub>S<sub>π</sub>
* Top-right: N<sub>0</sub>N<sub>π</sub>S<sub>π</sub>
* Bottom-left: N<sub>π</sub>N<sub>π,-15dB</sub>S<sub>π</sub>
* Bottom-right: N<sub>π,-15dB</sub>N<sub>π</sub>S<sub>π</sub>
### Detailed Analysis
**Top-Left Subplot (N<sub>π</sub>N<sub>0</sub>S<sub>π</sub>)**:
* **Subj A (Black Squares)**: Starts around 1 dB at -200 ms, drops sharply to approximately -14 dB around 100 ms, and remains relatively constant.
* **Subj B (Black Circles)**: Starts around 1 dB at -200 ms, drops sharply to approximately -14 dB around 100 ms, and remains relatively constant.
* **Subj C (Black Diamonds)**: Starts around 1 dB at -200 ms, drops sharply to approximately -14 dB around 100 ms, and remains relatively constant.
* **Subj D (Black Triangles)**: Starts around 1 dB at -200 ms, drops sharply to approximately -15 dB around 100 ms, and remains relatively constant.
* **BI<sub>L,R</sub> (Black Plus)**: Starts around 1 dB at -200 ms, drops sharply to approximately -10 dB around 100 ms, and remains relatively constant.
* **BI<sub>L,C,R</sub> (Black Horizontal Bar)**: Starts around 1 dB at -200 ms, drops sharply to approximately -10 dB around 100 ms, and remains relatively constant.
* **BMFD (Black Open Circles)**: Starts around 1 dB at -200 ms, drops sharply to approximately -10 dB around 100 ms, and remains relatively constant.
**Top-Right Subplot (N<sub>0</sub>N<sub>π</sub>S<sub>π</sub>)**:
* **Subj A (Black Squares)**: Starts around -15 dB, rises sharply to approximately 3 dB around 100 ms.
* **Subj B (Black Circles)**: Starts around -14 dB, rises sharply to approximately 3 dB around 100 ms.
* **Subj C (Black Diamonds)**: Starts around -14 dB, rises sharply to approximately 3 dB around 100 ms.
* **Subj D (Black Triangles)**: Starts around -15 dB, rises sharply to approximately 3 dB around 100 ms.
* **BI<sub>L,R</sub> (Black Plus)**: Starts around -10 dB, rises sharply to approximately 1 dB around 100 ms.
* **BI<sub>L,C,R</sub> (Black Horizontal Bar)**: Starts around -10 dB, rises sharply to approximately 1 dB around 100 ms.
* **BMFD (Black Open Circles)**: Starts around -10 dB, rises sharply to approximately 1 dB around 100 ms.
**Bottom-Left Subplot (N<sub>π</sub>N<sub>π,-15dB</sub>S<sub>π</sub>)**:
* **Subj A (Black Squares)**: Starts around 1 dB at -200 ms, drops sharply to approximately -14 dB around 100 ms, and remains relatively constant.
* **Subj B (Black Circles)**: Starts around 1 dB at -200 ms, drops sharply to approximately -14 dB around 100 ms, and remains relatively constant.
* **Subj C (Black Diamonds)**: Starts around 1 dB at -200 ms, drops sharply to approximately -14 dB around 100 ms, and remains relatively constant.
* **Subj D (Black Triangles)**: Starts around 1 dB at -200 ms, drops sharply to approximately -14 dB around 100 ms, and remains relatively constant.
* **BI<sub>L,R</sub> (Black Plus)**: Starts around 1 dB at -200 ms, drops sharply to approximately -14 dB around 100 ms, and remains relatively constant.
* **BI<sub>L,C,R</sub> (Black Horizontal Bar)**: Starts around 1 dB at -200 ms, drops sharply to approximately -14 dB around 100 ms, and remains relatively constant.
* **BMFD (Black Open Circles)**: Starts around 1 dB at -200 ms, drops sharply to approximately -14 dB around 100 ms, and remains relatively constant.
**Bottom-Right Subplot (N<sub>π,-15dB</sub>N<sub>π</sub>S<sub>π</sub>)**:
* **Subj A (Black Squares)**: Starts around -14 dB, rises sharply to approximately 3 dB around 100 ms.
* **Subj B (Black Circles)**: Starts around -14 dB, rises sharply to approximately 3 dB around 100 ms.
* **Subj C (Black Diamonds)**: Starts around -14 dB, rises sharply to approximately 3 dB around 100 ms.
* **Subj D (Black Triangles)**: Starts around -14 dB, rises sharply to approximately 3 dB around 100 ms.
* **BI<sub>L,R</sub> (Black Plus)**: Starts around -14 dB, rises sharply to approximately 3 dB around 100 ms.
* **BI<sub>L,C,R</sub> (Black Horizontal Bar)**: Starts around -14 dB, rises sharply to approximately 3 dB around 100 ms.
* **BMFD (Black Open Circles)**: Starts around -14 dB, rises sharply to approximately 3 dB around 100 ms.
### Key Observations
* The top-left and bottom-left subplots (N<sub>π</sub>N<sub>0</sub>S<sub>π</sub> and N<sub>π</sub>N<sub>π,-15dB</sub>S<sub>π</sub>) show a similar trend: a sharp decrease in masked threshold as delay time increases from negative values to around 100 ms, followed by a plateau.
* The top-right and bottom-right subplots (N<sub>0</sub>N<sub>π</sub>S<sub>π</sub> and N<sub>π,-15dB</sub>N<sub>π</sub>S<sub>π</sub>) show a similar trend: a sharp increase in masked threshold as delay time increases from negative values to around 100 ms, followed by a plateau.
* The individual subjects (A, B, C, D) exhibit very similar masked threshold values across all conditions.
* The BI<sub>L,R</sub>, BI<sub>L,C,R</sub>, and BMFD conditions also show similar trends but with slightly higher masked threshold values compared to the individual subjects.
### Interpretation
The data suggests that the delay time significantly affects the masked threshold, with a clear transition point around 0 ms. The specific configuration of the noise and signal (N and S) influences the direction of this effect. When the noise is initially out of phase (N<sub>π</sub>), the masked threshold decreases as the delay time increases. Conversely, when the noise is initially in phase (N<sub>0</sub>), the masked threshold increases as the delay time increases. The -15dB notation in the bottom subplots likely refers to a specific noise level or attenuation applied in those conditions. The similarity in the curves for individual subjects suggests consistent auditory processing across individuals. The slight difference in masked threshold for the BI<sub>L,R</sub>, BI<sub>L,C,R</sub>, and BMFD conditions may indicate a different underlying mechanism or a combined effect of multiple factors.
DECODING INTELLIGENCE...