## Chart/Diagram Type: Masked Threshold vs. Delay Time for Different Configurations
### Overview
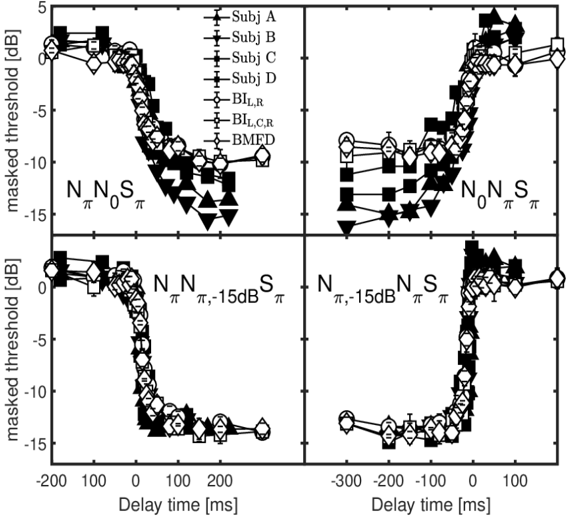
The image contains four quadrants of graphs, each representing masked threshold (dB) as a function of delay time (ms) for distinct experimental configurations. Each quadrant has a unique combination of "N" and "S" parameters (e.g., NNS, N-15dB S), with data points plotted using symbols corresponding to subjects (Subj A-D), baselines (BL_R, BL_CR), and BMFD. The graphs show sharp transitions in masked threshold around specific delay times, suggesting dynamic responses to experimental conditions.
### Components/Axes
- **X-axis (Delay Time, ms)**:
- Top-left and top-right graphs: -200 to 200 ms.
- Bottom-left and bottom-right graphs: -300 to 100 ms.
- **Y-axis (Masked Threshold, dB)**:
- All graphs: -15 to 5 dB.
- **Legends**:
- **Top-left corner**:
- Symbols:
- Circles: Subj A
- Triangles: Subj B
- Squares: Subj C
- Diamonds: Subj D
- Black crosses: BL_R
- White crosses: BL_CR
- Black triangles: BMFD
- **Axis labels**:
- Top-left graph: "NNS" (top-left), "NNS" (bottom-left).
- Top-right graph: "N0ππ" (top-left), "N0ππ" (bottom-left).
- Bottom-left graph: "Nππ-15dB" (top-left), "Nππ-15dB" (bottom-left).
- Bottom-right graph: "Nπ-15dB ππ" (top-left), "Nπ-15dB ππ" (bottom-left).
### Detailed Analysis
#### Top-Left Graph (NNS)
- **Trend**:
- Masked threshold starts at ~0 dB, drops sharply to ~-15 dB around -100 ms, then rises back to ~0 dB at 200 ms.
- **Data Points**:
- Subj A (circles): Peaks at ~0 dB at -200 ms, drops to ~-15 dB at -100 ms, rises to ~0 dB at 200 ms.
- Subj B (triangles): Similar trend but with slightly less depth in the trough.
- BL_R (black crosses): Steeper decline, reaching ~-15 dB at -100 ms.
- BMFD (black triangles): Gradual decline to ~-10 dB at 200 ms.
#### Top-Right Graph (N0ππ)
- **Trend**:
- Masked threshold starts at ~0 dB, declines gradually to ~-5 dB at 200 ms.
- **Data Points**:
- Subj C (squares): Steady decline from ~0 dB to ~-5 dB.
- BL_CR (white crosses): Slightly less steep decline, ending at ~-3 dB.
- BMFD (black triangles): Minimal change, remaining near 0 dB.
#### Bottom-Left Graph (Nππ-15dB)
- **Trend**:
- Masked threshold starts at ~0 dB, drops sharply to ~-15 dB at -150 ms, then rises to ~-5 dB at 100 ms.
- **Data Points**:
- Subj D (diamonds): Sharpest drop, reaching ~-15 dB at -150 ms.
- BL_R (black crosses): Similar sharp decline but recovers faster.
- BMFD (black triangles): Gradual decline to ~-10 dB.
#### Bottom-Right Graph (Nπ-15dB ππ)
- **Trend**:
- Masked threshold starts at ~0 dB, declines gradually to ~-5 dB at 100 ms.
- **Data Points**:
- Subj A (circles): Steady decline to ~-5 dB.
- BL_CR (white crosses): Slightly less steep, ending at ~-3 dB.
- BMFD (black triangles): Minimal change, remaining near 0 dB.
### Key Observations
1. **Configuration-Specific Responses**:
- NNS and Nππ-15dB configurations show the most pronounced threshold changes, suggesting sensitivity to "N" and "S" parameters.
- N0ππ and Nπ-15dB ππ configurations exhibit milder responses, indicating reduced sensitivity.
2. **Baseline Effects**:
- BL_R (black crosses) consistently shows sharper threshold drops compared to BL_CR (white crosses), implying different baseline conditions.
- BMFD (black triangles) remains relatively stable across configurations, possibly serving as a control.
3. **Delay Time Sensitivity**:
- Sharp transitions around -100 ms (NNS) and -150 ms (Nππ-15dB) suggest critical delay thresholds for the observed effects.
### Interpretation
The data demonstrates that experimental configurations (N/S parameters) and baseline conditions (BL_R/BL_CR) significantly influence masked threshold dynamics. The sharp declines in NNS and Nππ-15dB configurations may reflect specific neural or sensory processing events triggered by delay time. BMFD’s stability across configurations suggests it represents a baseline or reference condition. The differing responses of BL_R and BL_CR highlight the importance of baseline selection in interpreting results. These findings could inform the design of experiments targeting threshold modulation in sensory or cognitive tasks.