## Line Chart: Reward vs Steps (Mean Min/Max)
### Overview
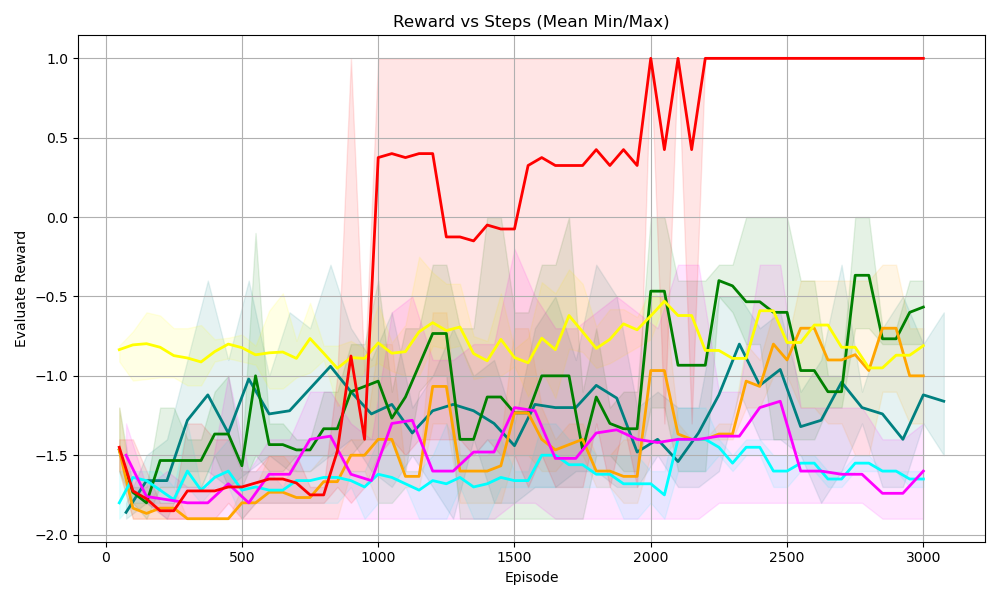
The chart visualizes the **evaluation reward** (Y-axis) across **training episodes** (X-axis, labeled “Episode”) for multiple data series (likely reinforcement learning agents or algorithms). Each series includes a *mean line* and a *shaded region* (representing minimum/maximum reward values or a confidence interval) to show variability. The X-axis spans 0–3000 episodes, and the Y-axis spans -2.0 to 1.0.
### Components/Axes
- **X-axis (Episode)**: Ticks at 0, 500, 1000, 1500, 2000, 2500, 3000. Represents the number of training episodes (steps).
- **Y-axis (Evaluate Reward)**: Ticks at -2.0, -1.5, -1.0, -0.5, 0.0, 0.5, 1.0. Represents the reward obtained during evaluation.
- **Legend (Implicit)**: Multiple colored lines (red, green, yellow, orange, cyan, magenta) with corresponding shaded areas (pink, light green, light yellow, light orange, light cyan, light magenta) indicating min/max ranges around the mean.
### Detailed Analysis
We analyze each data series (line + shaded area) by trend and variability:
#### 1. Red Line (Mean) + Pink Shaded Area
- **Trend**: Starts at ~-1.5 (episode 0), drops to ~-1.8 (episode 500), then *sharply rises* around episode 1000 to ~0.4. Fluctuates between ~-0.2 and 0.4 until episode 2000, then **spikes to 1.0** and remains stable.
- **Variability (Shaded Area)**: Pink region shows wider variability in early episodes (e.g., episode 0–1000) and narrower variability after episode 2000 (when reward stabilizes at 1.0).
#### 2. Green Line (Mean) + Light Green Shaded Area
- **Trend**: Starts at ~-1.8 (episode 0), fluctuates, reaches ~-1.0 around episode 1000, then *gradually rises* to ~-0.5 after episode 2000 (with fluctuations).
- **Variability**: Light green region is wider in early episodes (higher variance) and narrower later (lower variance).
#### 3. Yellow Line (Mean) + Light Yellow Shaded Area
- **Trend**: Relatively flat, starting at ~-0.8 (episode 0) and fluctuating slightly between ~-0.8 and -1.0 throughout.
- **Variability**: Light yellow region shows consistent, moderate variability.
#### 4. Orange Line (Mean) + Light Orange Shaded Area
- **Trend**: Starts at ~-1.8 (episode 0), fluctuates, reaches ~-1.5 around episode 1000, then *gradually rises* to ~-1.0 after episode 2000 (with fluctuations).
- **Variability**: Light orange region mirrors the green line’s variability (wider early, narrower later).
#### 5. Cyan Line (Mean) + Light Cyan Shaded Area
- **Trend**: Starts at ~-1.8 (episode 0), fluctuates, and stays around -1.5 to -1.8 (slight upward trend).
- **Variability**: Light cyan region shows consistent, moderate variability.
#### 6. Magenta Line (Mean) + Light Magenta Shaded Area
- **Trend**: Starts at ~-1.8 (episode 0), fluctuates, and stays around -1.5 to -1.8 (similar to cyan).
- **Variability**: Light magenta region shows consistent, moderate variability.
### Key Observations
- The **red line** demonstrates a *dramatic improvement*: it spikes to the maximum reward (1.0) after episode 2000 and stabilizes, indicating a breakthrough in learning.
- Most other lines (green, orange, cyan, magenta) show *gradual improvement* or stability, with the **yellow line** remaining relatively flat (possibly a baseline or less effective agent).
- **Variability (shaded areas)** is wider in early episodes (higher variance) and narrower in later episodes (lower variance) for most series, suggesting reduced performance variance as training progresses.
### Interpretation
This chart likely compares the performance of different reinforcement learning agents (or algorithms) over training episodes. The red agent’s sharp improvement and stable high reward suggest it converged to an optimal policy (or learned a critical skill). Other agents show more gradual progress, with the yellow agent possibly serving as a baseline. The reduction in variability over time implies that agents’ performance becomes more consistent as they train—indicating improved policy robustness or convergence.
The red agent’s success could highlight a superior learning algorithm, hyperparameter tuning, or environmental adaptation, while the other agents’ slower progress may reflect suboptimal policies or less effective learning dynamics.