## Scatter Plot Matrix: Fraction of Variance Explained by PCs
### Overview
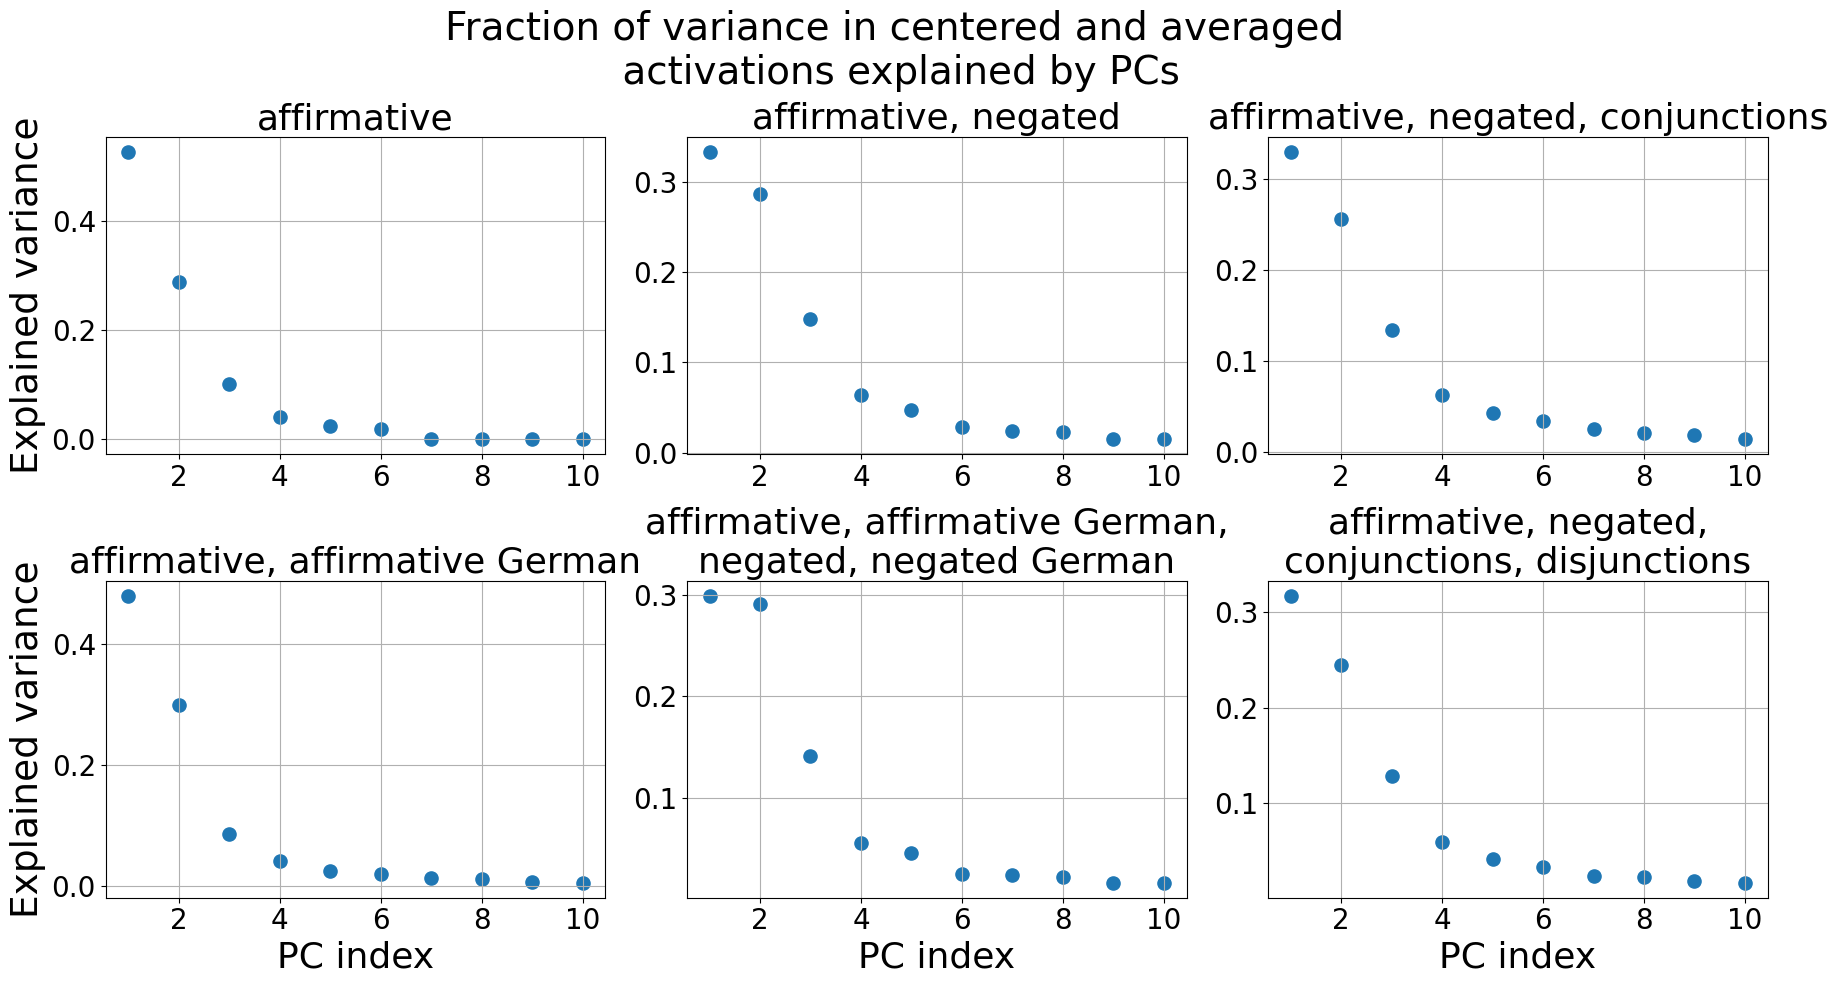
The image presents a 2x3 matrix of scatter plots. Each plot shows the fraction of variance in centered and averaged activations explained by Principal Components (PCs) for different linguistic conditions. The x-axis represents the PC index, ranging from 1 to 10, and the y-axis represents the explained variance, ranging from 0 to 0.4 or 0.3 depending on the plot. Each plot corresponds to a different combination of affirmative, negated, conjunction, disjunction, and German language conditions.
### Components/Axes
* **Title:** Fraction of variance in centered and averaged activations explained by PCs
* **X-axis (PC index):**
* Label: PC index
* Scale: 1 to 10, with tick marks at each integer value.
* **Y-axis (Explained variance):**
* Label: Explained variance
* Scale: Varies slightly between plots. Some go from 0 to 0.4, others from 0 to 0.3. Tick marks are present at intervals of 0.1.
* **Plot Titles (Conditions):**
* Top-left: affirmative
* Top-middle: affirmative, negated
* Top-right: affirmative, negated, conjunctions
* Bottom-left: affirmative, affirmative German
* Bottom-middle: affirmative, affirmative German, negated, negated German
* Bottom-right: affirmative, negated, conjunctions, disjunctions
### Detailed Analysis
Each scatter plot displays a similar trend: the explained variance decreases as the PC index increases. The first few PCs explain a significant portion of the variance, while the later PCs explain progressively less.
**Plot 1: affirmative**
* The explained variance for PC 1 is approximately 0.48.
* The explained variance for PC 2 is approximately 0.28.
* The explained variance for PC 3 is approximately 0.11.
* The explained variance for PC 4 is approximately 0.04.
* The explained variance for PC 10 is approximately 0.00.
**Plot 2: affirmative, negated**
* The explained variance for PC 1 is approximately 0.29.
* The explained variance for PC 2 is approximately 0.24.
* The explained variance for PC 3 is approximately 0.14.
* The explained variance for PC 4 is approximately 0.06.
* The explained variance for PC 10 is approximately 0.01.
**Plot 3: affirmative, negated, conjunctions**
* The explained variance for PC 1 is approximately 0.28.
* The explained variance for PC 2 is approximately 0.24.
* The explained variance for PC 3 is approximately 0.13.
* The explained variance for PC 4 is approximately 0.06.
* The explained variance for PC 10 is approximately 0.01.
**Plot 4: affirmative, affirmative German**
* The explained variance for PC 1 is approximately 0.46.
* The explained variance for PC 2 is approximately 0.30.
* The explained variance for PC 3 is approximately 0.10.
* The explained variance for PC 4 is approximately 0.04.
* The explained variance for PC 10 is approximately 0.01.
**Plot 5: affirmative, affirmative German, negated, negated German**
* The explained variance for PC 1 is approximately 0.29.
* The explained variance for PC 2 is approximately 0.28.
* The explained variance for PC 3 is approximately 0.14.
* The explained variance for PC 4 is approximately 0.05.
* The explained variance for PC 10 is approximately 0.01.
**Plot 6: affirmative, negated, conjunctions, disjunctions**
* The explained variance for PC 1 is approximately 0.31.
* The explained variance for PC 2 is approximately 0.24.
* The explained variance for PC 3 is approximately 0.12.
* The explained variance for PC 4 is approximately 0.06.
* The explained variance for PC 10 is approximately 0.01.
### Key Observations
* The first principal component (PC1) consistently explains the largest fraction of variance across all conditions.
* The explained variance decreases rapidly for the first few PCs and then plateaus.
* The "affirmative" and "affirmative, affirmative German" conditions show the highest explained variance by PC1, around 0.48 and 0.46 respectively.
* The addition of negation, conjunctions, and disjunctions generally reduces the explained variance by PC1.
### Interpretation
The plots demonstrate how much of the variance in neural activations can be captured by a small number of principal components under different linguistic conditions. The fact that the first few PCs explain most of the variance suggests that the neural representations are relatively low-dimensional. The differences in explained variance across conditions indicate that certain linguistic features (e.g., affirmation vs. negation) influence the structure of the neural representations. Specifically, affirmative sentences seem to have a more structured representation (higher variance explained by PC1) compared to sentences with negation, conjunctions, or disjunctions. The inclusion of German language data also appears to affect the explained variance, suggesting cross-linguistic differences in neural representation.