## Scatter Plots: Fraction of Variance Explained by PCs
### Overview
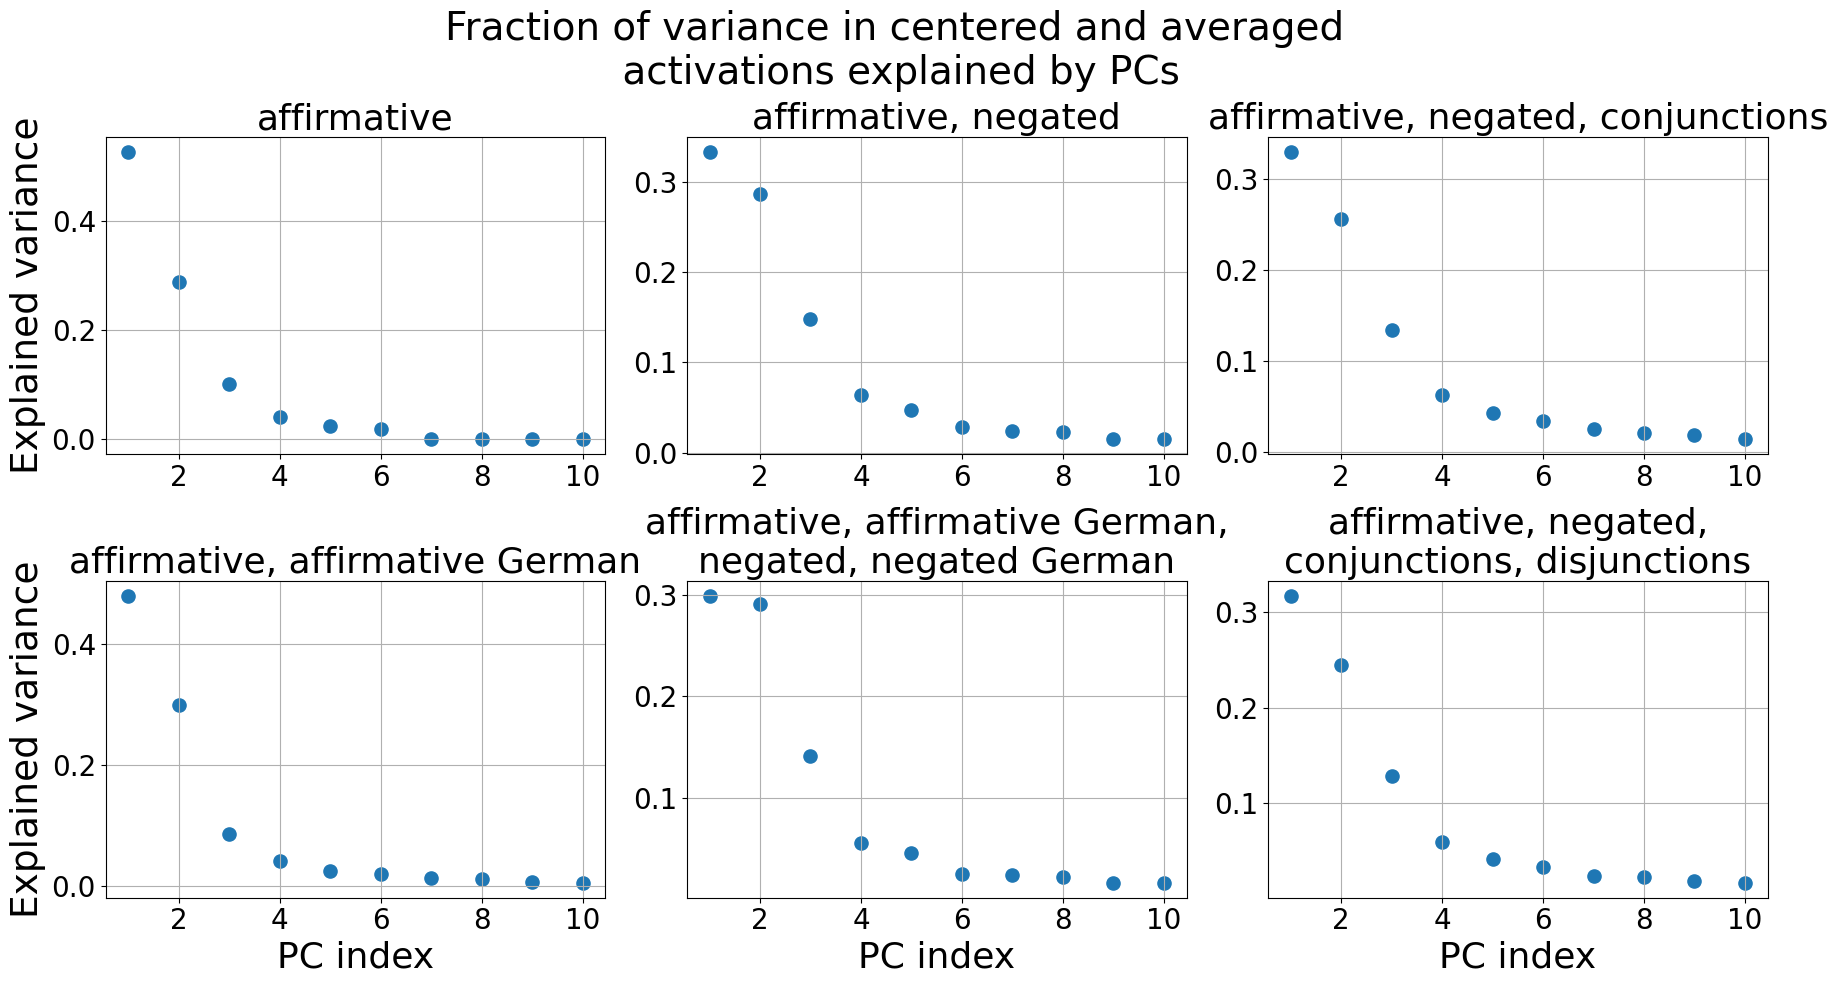
The image presents six scatter plots, each representing the fraction of variance in centered and averaged activations explained by Principal Components (PCs). Each plot corresponds to a different linguistic condition. The x-axis represents the PC index (ranging from 1 to 10), and the y-axis represents the explained variance (ranging from 0 to approximately 0.4).
### Components/Axes
* **Title:** "Fraction of variance in centered and averaged activations explained by PCs" (centered at the top)
* **X-axis Label:** "PC index" (present on all plots)
* **Y-axis Label:** "Explained variance" (present on all plots)
* **Plots (from top-left to bottom-right):**
1. "affirmative"
2. "affirmative, negated"
3. "affirmative, negated, conjunctions"
4. "affirmative, affirmative German"
5. "affirmative, affirmative German, negated, negated German"
6. "affirmative, negated, conjunctions, disjunctions"
* **Gridlines:** Present in all plots, providing a visual reference for data point positioning.
### Detailed Analysis or Content Details
**Plot 1: "affirmative"**
* Trend: The explained variance initially decreases rapidly, then plateaus.
* Data Points (approximate):
* PC Index 1: 0.38
* PC Index 2: 0.26
* PC Index 3: 0.14
* PC Index 4: 0.08
* PC Index 5: 0.04
* PC Index 6: 0.02
* PC Index 7: 0.01
* PC Index 8: 0.01
* PC Index 9: 0.005
* PC Index 10: 0.005
**Plot 2: "affirmative, negated"**
* Trend: Similar to Plot 1, with a rapid initial decrease followed by a plateau, but generally lower variance explained.
* Data Points (approximate):
* PC Index 1: 0.32
* PC Index 2: 0.16
* PC Index 3: 0.08
* PC Index 4: 0.05
* PC Index 5: 0.03
* PC Index 6: 0.02
* PC Index 7: 0.01
* PC Index 8: 0.01
* PC Index 9: 0.005
* PC Index 10: 0.005
**Plot 3: "affirmative, negated, conjunctions"**
* Trend: A similar decreasing trend, but with even lower explained variance.
* Data Points (approximate):
* PC Index 1: 0.35
* PC Index 2: 0.12
* PC Index 3: 0.06
* PC Index 4: 0.04
* PC Index 5: 0.03
* PC Index 6: 0.02
* PC Index 7: 0.01
* PC Index 8: 0.01
* PC Index 9: 0.005
* PC Index 10: 0.005
**Plot 4: "affirmative, affirmative German"**
* Trend: Similar to Plot 1, with a rapid initial decrease followed by a plateau.
* Data Points (approximate):
* PC Index 1: 0.42
* PC Index 2: 0.28
* PC Index 3: 0.08
* PC Index 4: 0.04
* PC Index 5: 0.02
* PC Index 6: 0.01
* PC Index 7: 0.01
* PC Index 8: 0.005
* PC Index 9: 0.005
* PC Index 10: 0.005
**Plot 5: "affirmative, affirmative German, negated, negated German"**
* Trend: Similar to Plot 2, with a rapid initial decrease followed by a plateau, but generally lower variance explained.
* Data Points (approximate):
* PC Index 1: 0.34
* PC Index 2: 0.18
* PC Index 3: 0.07
* PC Index 4: 0.05
* PC Index 5: 0.03
* PC Index 6: 0.02
* PC Index 7: 0.01
* PC Index 8: 0.01
* PC Index 9: 0.005
* PC Index 10: 0.005
**Plot 6: "affirmative, negated, conjunctions, disjunctions"**
* Trend: A similar decreasing trend, but with even lower explained variance.
* Data Points (approximate):
* PC Index 1: 0.36
* PC Index 2: 0.14
* PC Index 3: 0.06
* PC Index 4: 0.04
* PC Index 5: 0.03
* PC Index 6: 0.02
* PC Index 7: 0.01
* PC Index 8: 0.01
* PC Index 9: 0.005
* PC Index 10: 0.005
### Key Observations
* The first PC consistently explains the largest fraction of variance across all conditions.
* The explained variance generally decreases rapidly with increasing PC index, indicating that a small number of PCs capture most of the variance.
* The "affirmative, affirmative German" condition shows the highest explained variance overall.
* The conditions involving negation, conjunctions, and disjunctions tend to have lower explained variance, suggesting that these linguistic features introduce more complexity.
### Interpretation
These plots demonstrate how much of the variability in the activations of a neural network (or similar model) can be captured by a set of principal components for different linguistic conditions. The fact that the first PC explains a substantial portion of the variance suggests that there is a dominant mode of variation in the activations. The decreasing explained variance with increasing PC index indicates diminishing returns – each subsequent PC captures less and less of the remaining variability.
The differences in explained variance between the conditions suggest that different linguistic features have varying degrees of impact on the model's internal representations. The higher variance explained by the "affirmative, affirmative German" condition might indicate that this condition is more easily represented by the model, or that the model has learned more robust features for this type of input. Conversely, the lower variance explained by conditions involving negation, conjunctions, and disjunctions could suggest that these features require more complex representations, or that the model has not fully learned to capture their nuances.
The plots provide insights into the model's ability to encode and process different linguistic structures, and could be used to identify areas where the model might be struggling or where further training is needed.