## Scatter Plot Grid: Fraction of Variance in Centered and Averaged Activations Explained by PCs
### Overview
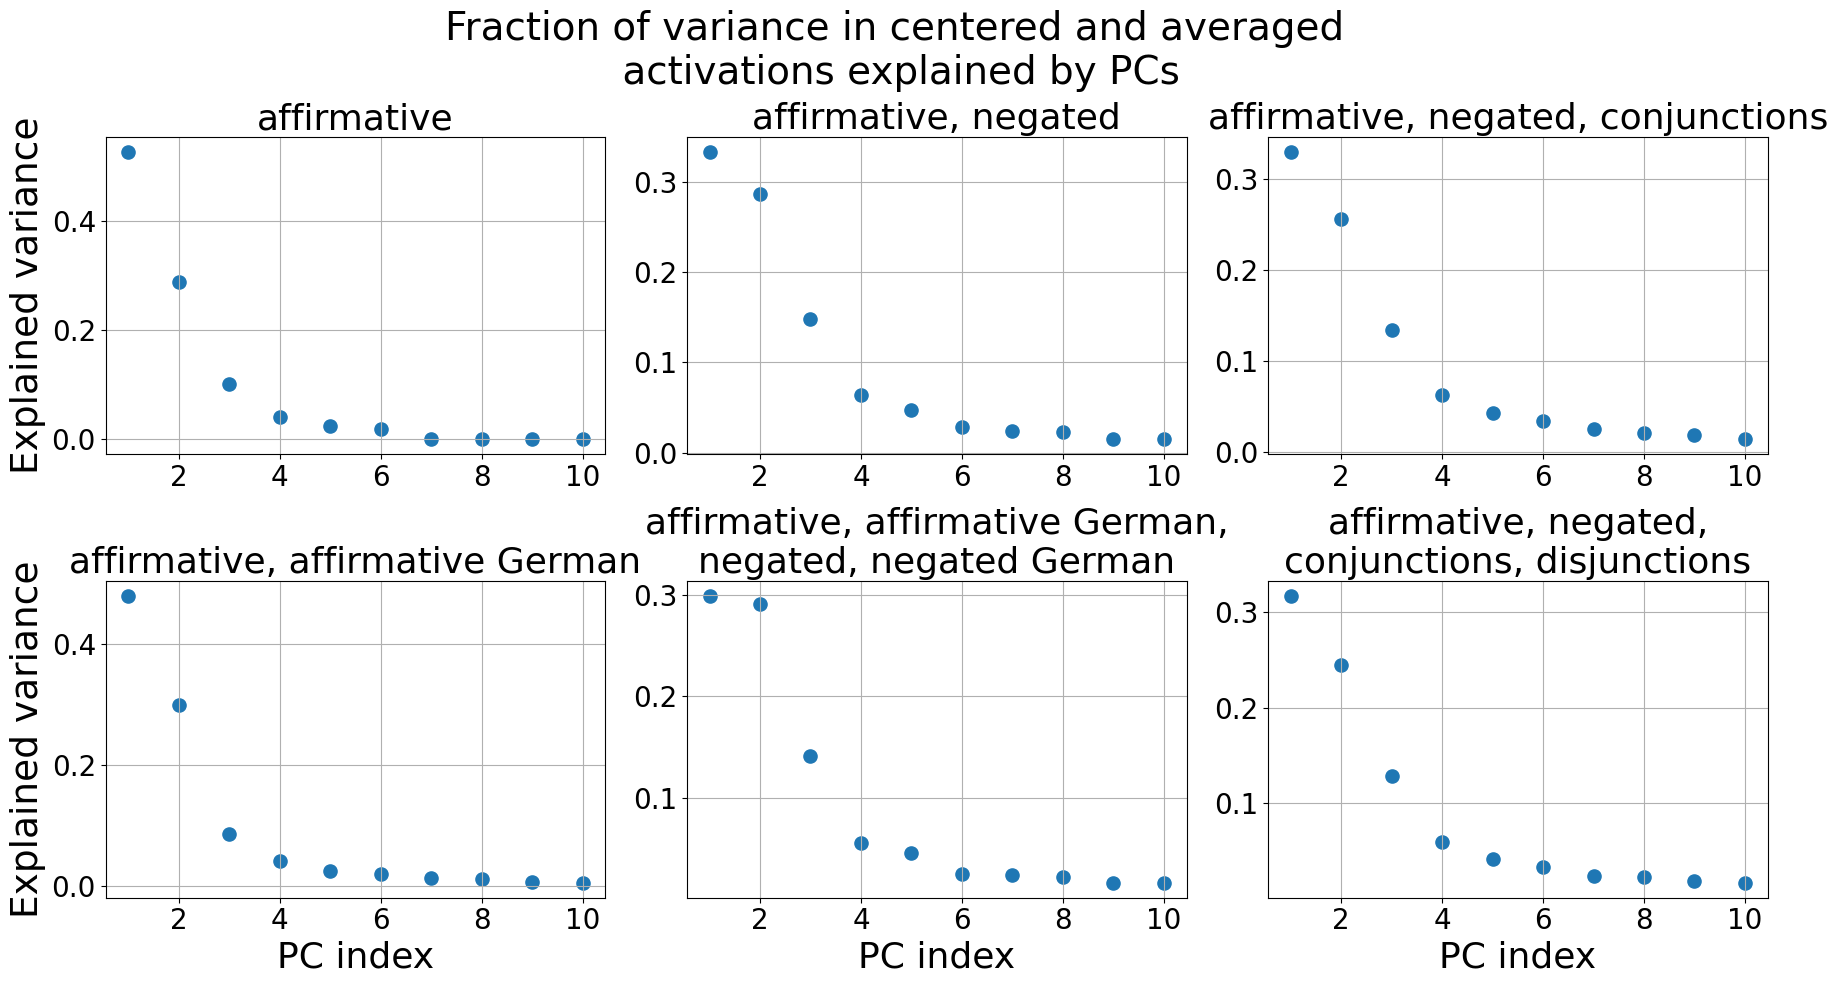
The image contains six scatter plots arranged in a 2x3 grid, each visualizing the relationship between principal component (PC) indices and explained variance for different linguistic conditions. All plots share identical axes but vary in their categorical labels, which describe combinations of linguistic features (e.g., "affirmative," "negated," "conjunctions," "disjunctions") and language-specific terms ("German").
### Components/Axes
- **X-axis**: "PC index" (ranges from 2 to 10 in integer increments).
- **Y-axis**: "Explained variance" (ranges from 0 to 0.4 in 0.1 increments).
- **Legend**: No explicit legend is present, but all data points are uniformly blue, suggesting a single data series per plot.
- **Plot Titles**: Each plot is labeled with a unique combination of linguistic conditions (see "Content Details" below).
### Detailed Analysis
#### Plot 1: "affirmative"
- **Trend**: A sharp decline in explained variance after PC index 2.
- **Data Points**:
- PC 2: ~0.45
- PC 3: ~0.1
- PC 4–10: ~0.01–0.02
#### Plot 2: "affirmative, negated"
- **Trend**: Moderate decline after PC index 2.
- **Data Points**:
- PC 2: ~0.3
- PC 3: ~0.15
- PC 4–10: ~0.03–0.05
#### Plot 3: "affirmative, negated, conjunctions"
- **Trend**: Similar to Plot 2 but with slightly lower values.
- **Data Points**:
- PC 2: ~0.3
- PC 3: ~0.15
- PC 4–10: ~0.03–0.05
#### Plot 4: "affirmative, affirmative German"
- **Trend**: Steeper decline than Plot 1.
- **Data Points**:
- PC 2: ~0.45
- PC 3: ~0.25
- PC 4–10: ~0.01–0.02
#### Plot 5: "affirmative, affirmative German, negated, negated German"
- **Trend**: Gradual decline after PC index 2.
- **Data Points**:
- PC 2: ~0.3
- PC 3: ~0.15
- PC 4–10: ~0.03–0.05
#### Plot 6: "affirmative, negated, conjunctions, disjunctions"
- **Trend**: Consistent with Plots 2–3 but with slightly lower values.
- **Data Points**:
- PC 2: ~0.3
- PC 3: ~0.15
- PC 4–10: ~0.03–0.05
### Key Observations
1. **Dominance of PC 2**: Across all plots, PC index 2 consistently explains the highest variance (~0.3–0.45), suggesting it captures the most significant linguistic patterns.
2. **Impact of Linguistic Complexity**: Adding features like negation, conjunctions, or disjunctions reduces the variance explained by PC 2 and 3, indicating these features may be distributed across later components.
3. **Language-Specific Effects**: Including "German" terms (e.g., "affirmative German") does not significantly alter the trend but slightly lowers variance in PC 3 compared to non-German conditions.
4. **Consistency in Decline**: All plots show a sharp drop in explained variance after PC 3, with minimal variance in PCs 4–10.
### Interpretation
The data suggests that the first principal component (PC 2) is the strongest predictor of variance in centered and averaged activations, particularly for affirmative statements. The inclusion of additional linguistic features (negation, conjunctions, disjunctions) or language-specific terms (German) reduces the explanatory power of the first few PCs, implying these elements may be encoded in later components or require more complex representations. The consistent pattern across plots highlights the robustness of PC 2 in capturing core linguistic structures, while subsequent PCs reflect incremental or nuanced variations.