## Heatmap: Avg JS Divergence by Layer and Category
### Overview
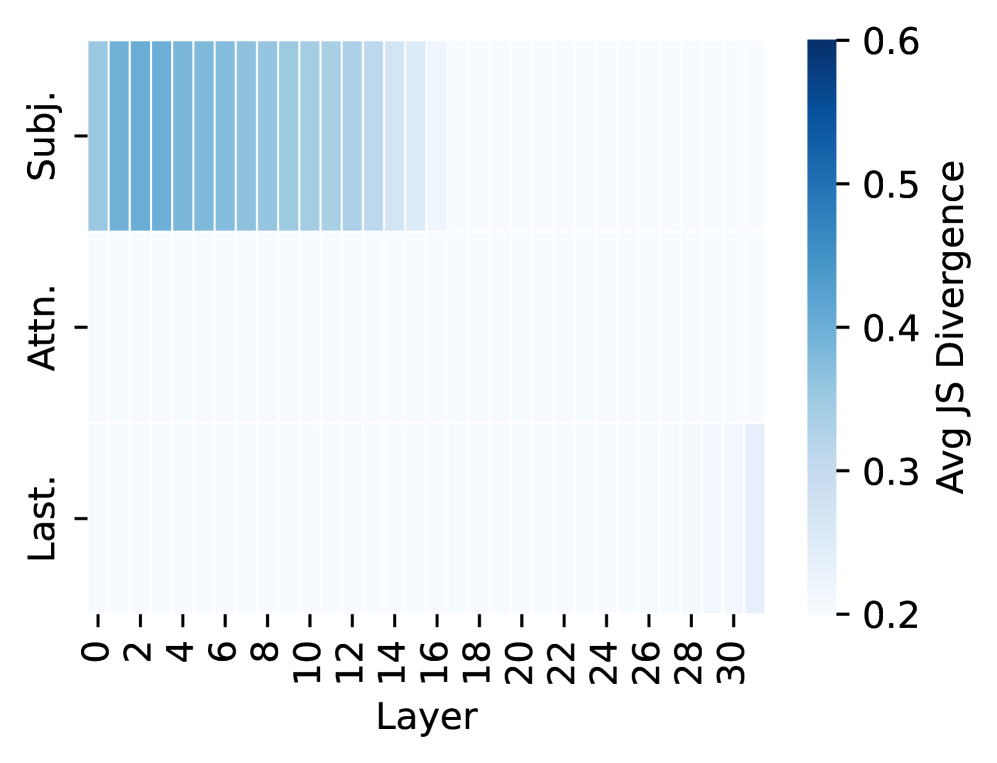
The image is a heatmap visualizing the average Jensen-Shannon (JS) divergence across different layers (0-30) for three categories: Subj. (Subject), Attn. (Attention), and Last. The color intensity represents the magnitude of the JS divergence, ranging from light blue (low divergence) to dark blue (high divergence).
### Components/Axes
* **X-axis:** Layer, with values ranging from 0 to 30 in increments of 2.
* **Y-axis:** Categories: Subj., Attn., Last.
* **Color Scale (Legend):** Avg JS Divergence, ranging from 0.2 (light blue) to 0.6 (dark blue). The scale has markers at 0.2, 0.3, 0.4, 0.5, and 0.6.
### Detailed Analysis
* **Subj. (Subject):** The JS divergence for the "Subj." category is relatively high (blue color) for layers 0 to approximately 16. The color intensity gradually decreases from layer 0 to 16, indicating a decreasing JS divergence. After layer 16, the JS divergence drops significantly and remains low (light blue).
* Layer 0: Approximately 0.55 JS Divergence
* Layer 8: Approximately 0.45 JS Divergence
* Layer 16: Approximately 0.35 JS Divergence
* **Attn. (Attention):** The JS divergence for the "Attn." category is consistently low (light blue) across all layers (0-30). The values appear to be close to 0.2.
* **Last.:** The JS divergence for the "Last." category is consistently low (light blue) across all layers (0-30). The values appear to be close to 0.2.
### Key Observations
* The "Subj." category exhibits a significantly higher JS divergence in the initial layers (0-16) compared to the "Attn." and "Last." categories.
* The JS divergence for the "Attn." and "Last." categories remains consistently low across all layers.
* There is a clear transition in the "Subj." category around layer 16, where the JS divergence drops sharply.
### Interpretation
The heatmap suggests that the "Subject" category has a higher degree of divergence in the earlier layers of the model, indicating that the representations or information related to the subject are more variable or less stable in these initial layers. The "Attention" and "Last" categories, on the other hand, show consistently low divergence across all layers, suggesting more stable representations. The sharp drop in JS divergence for the "Subject" category after layer 16 could indicate a point where the model has effectively learned or stabilized the subject-related information. This could be due to the model learning to extract relevant features or representations related to the subject in the earlier layers, and then refining or stabilizing these representations in the later layers.