## Heatmap: Average Jensen-Shannon Divergence Across Model Layers
### Overview
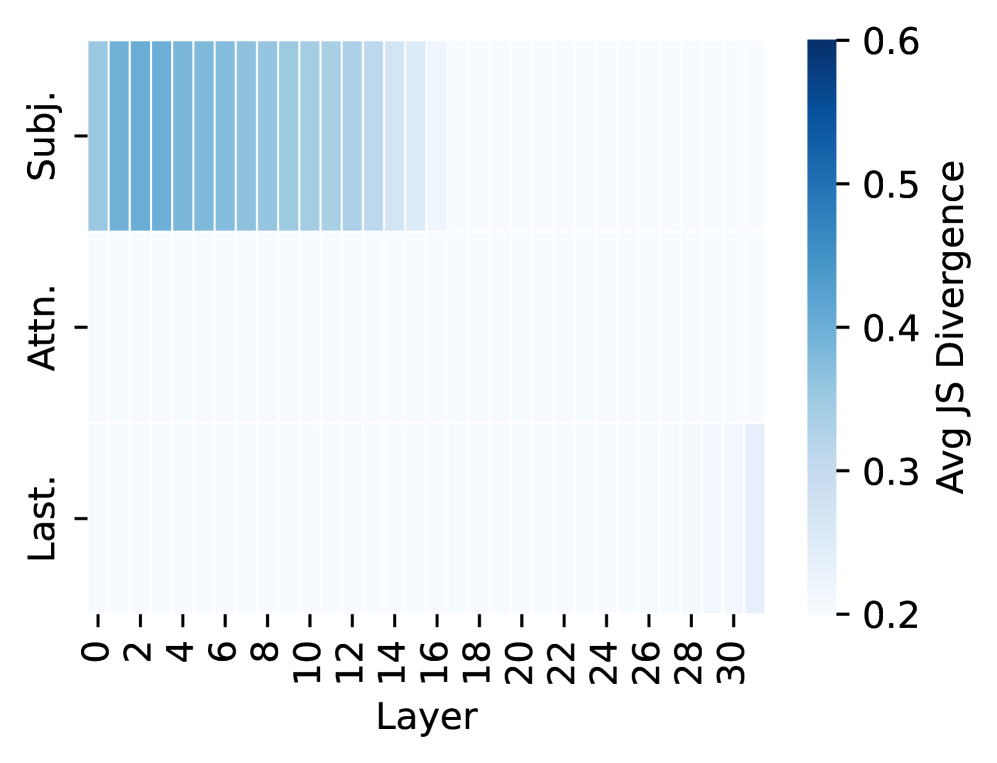
The image is a heatmap visualizing the "Avg JS Divergence" (Average Jensen-Shannon Divergence) across different layers of a model for three distinct categories. The heatmap uses a blue color gradient to represent divergence values, with darker blue indicating higher divergence. The data suggests a comparison of how different components or representations within a model diverge from a reference distribution as information propagates through its layers.
### Components/Axes
* **Chart Type:** Heatmap.
* **X-Axis:** Labeled **"Layer"**. It represents model layers, with numerical markers at intervals of 2, ranging from **0 to 30**.
* **Y-Axis:** Contains three categorical labels, positioned on the left side of the heatmap:
1. **"Subj."** (Top row)
2. **"Attn."** (Middle row)
3. **"Last."** (Bottom row)
* **Color Bar/Legend:** Positioned on the right side of the chart. It is labeled **"Avg JS Divergence"** and provides a scale for interpreting the heatmap colors.
* **Scale Range:** Approximately **0.2 to 0.6**.
* **Color Gradient:** A sequential blue palette where lighter shades (near white/light blue) correspond to lower values (~0.2) and darker, saturated blue corresponds to higher values (~0.6).
### Detailed Analysis
The heatmap displays a 3 (categories) x 16 (layer intervals) grid of colored cells. The color intensity represents the average JS Divergence value for that category at that layer.
1. **"Subj." Row (Top):**
* **Trend:** This row shows the highest divergence values, which are concentrated in the earlier layers and gradually decrease.
* **Data Points:** The cells from **Layer 0 to approximately Layer 16** are colored in varying shades of medium to dark blue. The darkest blue (highest divergence, ~0.5-0.6) appears in the very first layers (0-4). The color progressively lightens as the layer number increases, becoming very light blue (divergence ~0.25-0.3) by Layer 16 and remaining light for layers beyond.
2. **"Attn." Row (Middle):**
* **Trend:** This row exhibits consistently low divergence across all layers.
* **Data Points:** All cells in this row are a very light blue or off-white color, indicating divergence values at the low end of the scale, approximately **0.2 to 0.25**. There is no significant visual trend or variation across layers.
3. **"Last." Row (Bottom):**
* **Trend:** This row also shows low divergence overall, with a very slight increase visible in the final layers.
* **Data Points:** Most cells are light blue, similar to the "Attn." row (~0.2-0.25). However, in the final columns corresponding to **Layers 28 and 30**, the blue shade becomes slightly more pronounced, suggesting a minor increase in divergence to approximately **0.25-0.3**.
### Key Observations
* **Dominant Pattern:** The most striking feature is the high divergence in the "Subj." category during the early to mid-layers (0-16), which sharply contrasts with the low, stable divergence of the "Attn." and "Last." categories.
* **Layer Sensitivity:** The "Subj." representation appears to be highly sensitive to layer depth, undergoing significant change (high divergence) early in the network before stabilizing.
* **Stability of Attention:** The "Attn." component shows remarkable stability (low divergence) throughout the entire depth of the model.
* **Late Divergence in "Last.":** There is a subtle but observable uptick in divergence for the "Last." category in the very final layers (28-30).
### Interpretation
This heatmap likely analyzes the internal dynamics of a deep neural network, possibly a transformer model given the "Attn." (Attention) label. Jensen-Shannon Divergence measures the similarity between two probability distributions.
* **What the data suggests:** The high early divergence for **"Subj."** implies that the model's representation of the "subject" (or a subject-related feature) changes dramatically in the initial processing stages. This could indicate the model is actively constructing or refining this concept from raw input.
* **Relationship between elements:** The stark contrast between "Subj." and "Attn." suggests these components play fundamentally different roles. The attention mechanism ("Attn.") appears to operate on a stable, consistent distribution across layers, perhaps serving as a reliable routing or weighting function. In contrast, the subject representation is highly dynamic.
* **Notable anomaly/trend:** The slight rise in divergence for **"Last."** in the final layers is intriguing. It may indicate that the final output representation ("Last") begins to diverge slightly from an intermediate representation as it is fine-tuned for the specific task output, or it could be an artifact of the final layer normalization.
* **Underlying significance:** This visualization helps diagnose where and how a model transforms information. The early, high-divergence zone for "Subj." pinpoints a critical phase of feature formation, while the stability of "Attn." confirms its role as a consistent computational primitive. This kind of analysis is crucial for understanding model interpretability, debugging representation learning, and guiding architectural improvements.