## Scatter Plot: Reasoning Tokens vs. Problem Size by Difficulty
### Overview
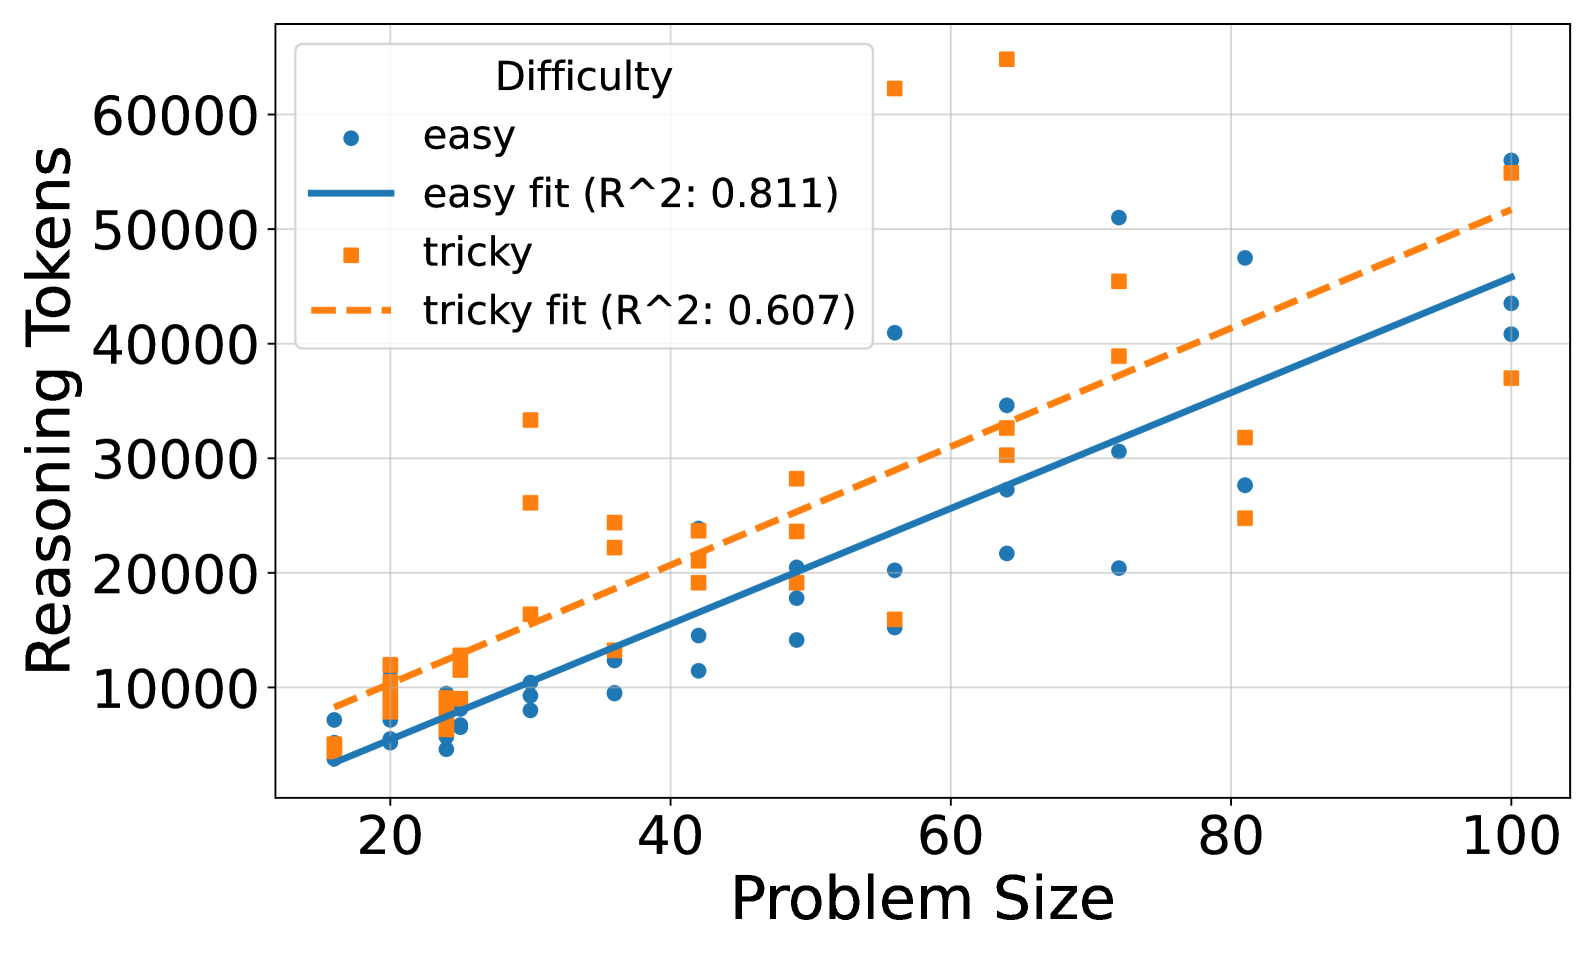
The image is a scatter plot showing the relationship between "Reasoning Tokens" and "Problem Size" for two categories of problem difficulty: "easy" and "tricky". Each category has a scatter plot of data points and a linear regression fit line with an R-squared value. The plot aims to visualize how the number of reasoning tokens changes with problem size for different difficulty levels.
### Components/Axes
* **X-axis:** "Problem Size", with a numerical scale ranging from 20 to 100 in increments of 20.
* **Y-axis:** "Reasoning Tokens", with a numerical scale ranging from 0 to 60000 in increments of 10000.
* **Legend (top-left):**
* "Difficulty"
* Blue circle: "easy"
* Solid blue line: "easy fit (R^2: 0.811)"
* Orange square: "tricky"
* Dashed orange line: "tricky fit (R^2: 0.607)"
### Detailed Analysis
**1. Easy Problems (Blue Circles and Solid Blue Line):**
* **Trend:** The "easy" data points generally show an upward trend, indicating that as the problem size increases, the number of reasoning tokens also tends to increase.
* **Data Points:**
* At Problem Size = 20, Reasoning Tokens range from approximately 4000 to 10000.
* At Problem Size = 40, Reasoning Tokens range from approximately 8000 to 15000.
* At Problem Size = 60, Reasoning Tokens range from approximately 15000 to 22000.
* At Problem Size = 80, Reasoning Tokens range from approximately 20000 to 50000.
* At Problem Size = 100, Reasoning Tokens range from approximately 40000 to 55000.
* **Fit Line:** The solid blue line represents the linear regression fit for the "easy" data. It has an R-squared value of 0.811, indicating a strong positive linear relationship.
**2. Tricky Problems (Orange Squares and Dashed Orange Line):**
* **Trend:** The "tricky" data points also show an upward trend, but with more variability compared to the "easy" data.
* **Data Points:**
* At Problem Size = 20, Reasoning Tokens range from approximately 8000 to 12000.
* At Problem Size = 40, Reasoning Tokens range from approximately 10000 to 35000.
* At Problem Size = 60, Reasoning Tokens range from approximately 15000 to 65000.
* At Problem Size = 80, Reasoning Tokens range from approximately 25000 to 30000.
* At Problem Size = 100, Reasoning Tokens range from approximately 35000 to 55000.
* **Fit Line:** The dashed orange line represents the linear regression fit for the "tricky" data. It has an R-squared value of 0.607, indicating a moderate positive linear relationship.
### Key Observations
* Both "easy" and "tricky" problems show a positive correlation between problem size and the number of reasoning tokens.
* The "easy" problems have a higher R-squared value (0.811) compared to the "tricky" problems (0.607), suggesting a stronger linear relationship between problem size and reasoning tokens for "easy" problems.
* The "tricky" problems exhibit more variability in the number of reasoning tokens for a given problem size, as indicated by the wider spread of data points around the regression line.
* For smaller problem sizes (around 20), the reasoning tokens are similar for both easy and tricky problems. However, as the problem size increases, the "tricky" problems tend to require more reasoning tokens than the "easy" problems.
### Interpretation
The data suggests that as problem size increases, the number of reasoning tokens required to solve the problem also increases, regardless of the difficulty level. However, the relationship is stronger and more predictable for "easy" problems compared to "tricky" problems. The lower R-squared value for "tricky" problems indicates that other factors, besides problem size, may significantly influence the number of reasoning tokens required. These factors could include the specific nature of the problem, the complexity of the reasoning steps, or the presence of misleading information. The greater variability in reasoning tokens for "tricky" problems suggests that these problems may require more diverse and potentially less efficient reasoning strategies. The fact that "tricky" problems tend to require more reasoning tokens than "easy" problems as problem size increases is intuitive, as "tricky" problems likely involve more complex logic or require more steps to arrive at a solution.