## Scatter Plot: Reasoning Tokens vs. Problem Size
### Overview
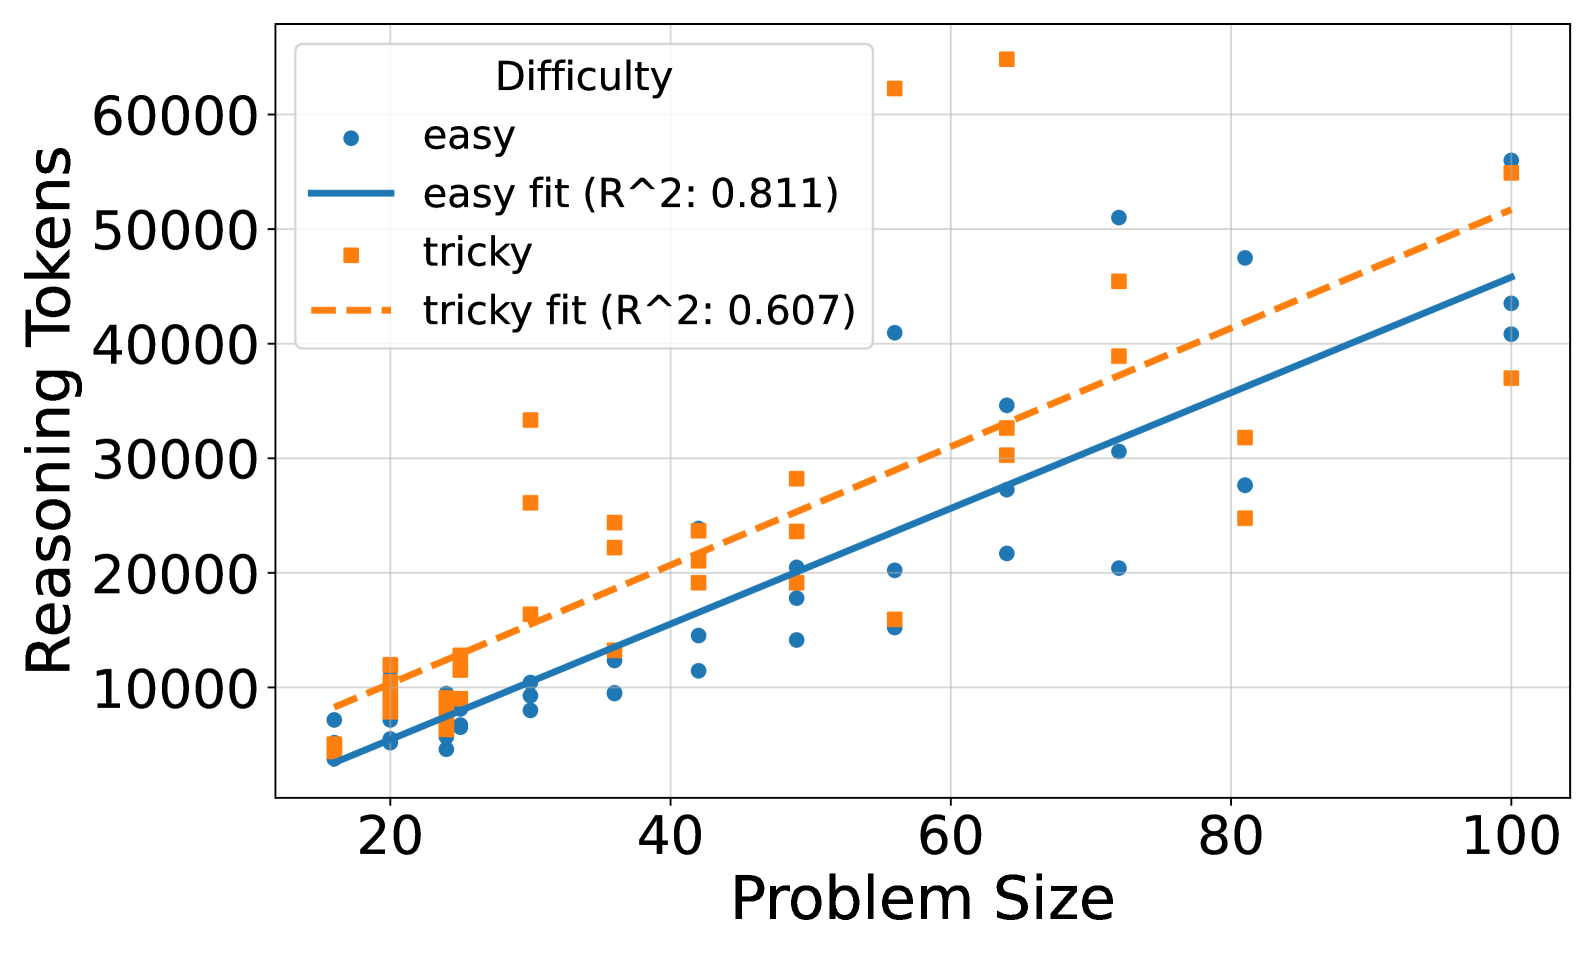
This image presents a scatter plot illustrating the relationship between "Problem Size" and "Reasoning Tokens" for two levels of "Difficulty": "easy" and "tricky". Linear regression fits are overlaid on each data series, with R-squared values provided. The plot aims to demonstrate how the number of reasoning tokens required scales with problem size, and how this scaling differs between easy and tricky problems.
### Components/Axes
* **X-axis:** "Problem Size" - Scale ranges from approximately 15 to 105, with tick marks at 20, 40, 60, 80, and 100.
* **Y-axis:** "Reasoning Tokens" - Scale ranges from approximately 5000 to 65000, with tick marks at 10000, 20000, 30000, 40000, 50000, and 60000.
* **Legend:** Located in the top-left corner.
* "easy" - Represented by blue circles.
* "easy fit (R^2: 0.811)" - Represented by a solid blue line.
* "tricky" - Represented by orange squares.
* "tricky fit (R^2: 0.607)" - Represented by a dashed orange line.
* **Title:** Not explicitly present, but the plot's content suggests a title relating to reasoning token scaling.
### Detailed Analysis
**Easy Data Series:**
The "easy" data series (blue circles) shows a generally upward trend. The data points are scattered around the blue regression line.
* At Problem Size ≈ 20, Reasoning Tokens ≈ 7000.
* At Problem Size ≈ 40, Reasoning Tokens ≈ 14000.
* At Problem Size ≈ 60, Reasoning Tokens ≈ 24000.
* At Problem Size ≈ 80, Reasoning Tokens ≈ 34000.
* At Problem Size ≈ 100, Reasoning Tokens ≈ 43000.
The "easy fit" line has a positive slope, indicating that as problem size increases, the number of reasoning tokens also increases. The R-squared value of 0.811 suggests a strong linear fit.
**Tricky Data Series:**
The "tricky" data series (orange squares) also exhibits an upward trend, but with more variability than the "easy" data.
* At Problem Size ≈ 20, Reasoning Tokens ≈ 8000.
* At Problem Size ≈ 40, Reasoning Tokens ≈ 20000.
* At Problem Size ≈ 60, Reasoning Tokens ≈ 32000.
* At Problem Size ≈ 80, Reasoning Tokens ≈ 25000.
* At Problem Size ≈ 100, Reasoning Tokens ≈ 50000.
The "tricky fit" line also has a positive slope, but is less steep than the "easy fit" line. The R-squared value of 0.607 indicates a moderate linear fit.
### Key Observations
* The "tricky" problems generally require more reasoning tokens than "easy" problems for the same problem size, especially at larger problem sizes.
* The "easy" data has a tighter distribution around its regression line, indicating a more predictable relationship between problem size and reasoning tokens.
* The "tricky" data is more scattered, suggesting that the relationship between problem size and reasoning tokens is less consistent for these problems.
* There is an outlier in the "tricky" data at Problem Size ≈ 80, where Reasoning Tokens ≈ 25000, which is lower than the trendline would suggest.
* The R-squared value for the "easy" fit is significantly higher than for the "tricky" fit, indicating a stronger linear relationship for the "easy" problems.
### Interpretation
The data suggests that the computational cost of reasoning (as measured by reasoning tokens) increases with problem size. However, the rate of increase, and the consistency of that increase, are affected by the difficulty of the problem. "Easy" problems exhibit a more predictable, linear scaling, while "tricky" problems show greater variability. This could indicate that "tricky" problems require more complex or nuanced reasoning strategies, leading to a wider range of token usage. The higher R-squared value for the "easy" fit suggests that a linear model is a better approximation of the relationship between problem size and reasoning tokens for these problems. The outlier in the "tricky" data might represent a problem that was solved in an unexpectedly efficient way, or a data recording error. The difference in slopes between the two regression lines suggests that the marginal cost of increasing problem size is higher for "tricky" problems than for "easy" problems.