## Scatter Plot: Reasoning Tokens vs Problem Size
### Overview
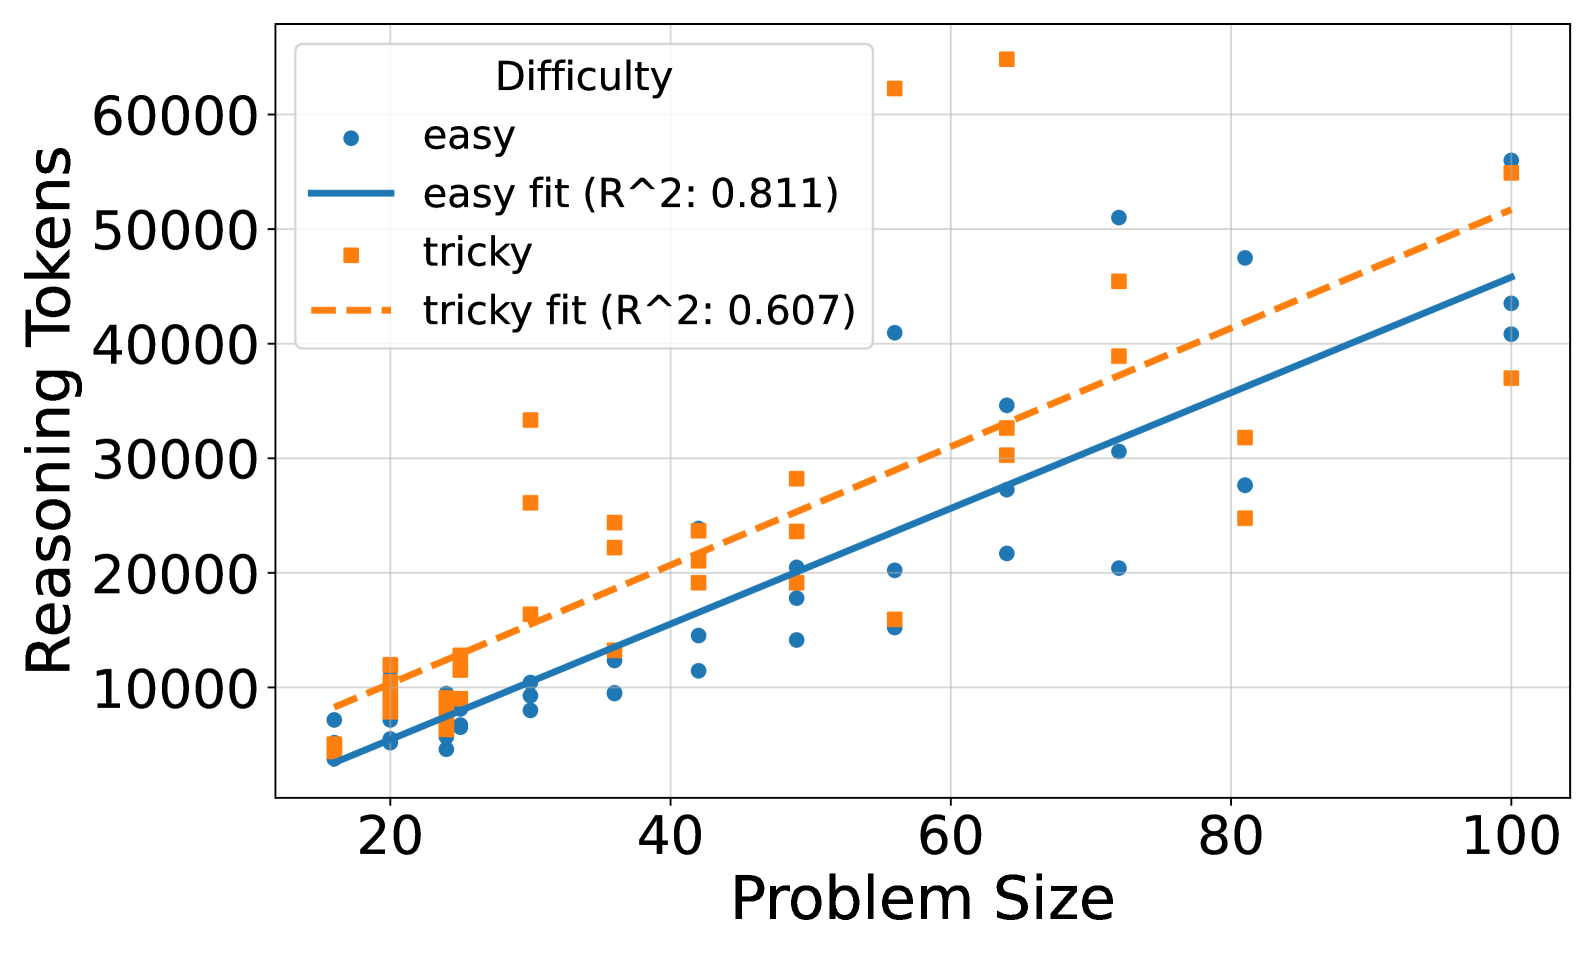
The image is a scatter plot comparing reasoning tokens required for "easy" and "tricky" problem types across varying problem sizes (20-100). Two trend lines with R² values are overlaid to show correlation strength.
### Components/Axes
- **X-axis**: Problem Size (20-100, linear scale)
- **Y-axis**: Reasoning Tokens (0-60,000, linear scale)
- **Legend**:
- Top-left corner
- Blue circles: "easy" (solid line, R²=0.811)
- Orange squares: "tricky" (dashed line, R²=0.607)
### Detailed Analysis
1. **Easy Data Series**:
- Blue circles show a strong positive linear trend (R²=0.811)
- At problem size 20: ~5,000 tokens
- At problem size 100: ~55,000 tokens
- Consistent upward trajectory with minimal scatter
2. **Tricky Data Series**:
- Orange squares show weaker positive trend (R²=0.607)
- At problem size 20: ~8,000 tokens
- At problem size 100: ~52,000 tokens
- Greater vertical dispersion, especially at mid-problem sizes (40-80)
3. **Trend Lines**:
- Solid blue line (easy) has steeper slope than dashed orange line (tricky)
- Both lines pass through origin but diverge at higher problem sizes
### Key Observations
- **Correlation Strength**: Easy problems show significantly stronger linear relationship (R²=0.811 vs 0.607)
- **Token Scaling**: Both problem types scale similarly at extremes (20 and 100), but diverge in mid-range
- **Outliers**: Tricky problems show 3-4 data points exceeding trend line predictions at problem sizes 60-80
- **Data Density**: Higher concentration of data points in 40-60 problem size range for both series
### Interpretation
The data demonstrates that while both easy and tricky problems require increasing tokens with problem size, easy problems exhibit more predictable scaling. The higher R² value for easy problems suggests better model generalizability for these cases. The convergence at problem size 100 implies both types reach similar complexity thresholds at maximum size, despite different difficulty classifications. The scattered nature of tricky problems indicates potential confounding variables affecting token requirements beyond problem size alone. This pattern could inform resource allocation strategies for AI systems handling mixed difficulty tasks.