## Scatter Plot: Log-Log Comparison of Anomaly and Initial Values
### Overview
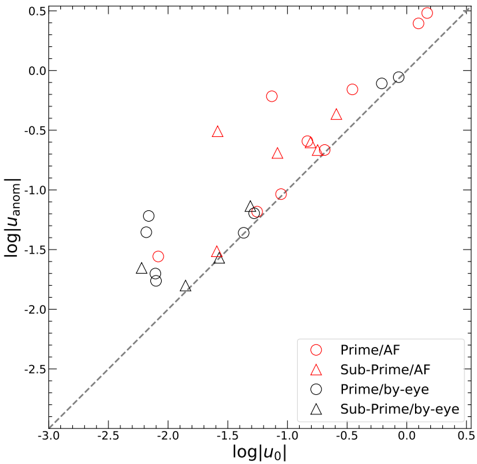
The image is a scatter plot comparing the logarithm of the absolute value of an anomaly (log|u_anom|) against the logarithm of the absolute value of an initial value (log|u_0|). The plot displays four distinct data series, each represented by a different marker and color, corresponding to different experimental conditions: Prime/AF (red circles), Sub-Prime/AF (red triangles), Prime/by-eye (black circles), and Sub-Prime/by-eye (black triangles). A dashed gray line represents the identity line (y=x).
### Components/Axes
* **X-axis:** log|u_0| (logarithm of the absolute value of the initial value). Scale ranges from approximately -3.0 to 0.5, with tick marks at intervals of 0.5.
* **Y-axis:** log|u_anom| (logarithm of the absolute value of the anomaly). Scale ranges from approximately -3.0 to 0.5, with tick marks at intervals of 0.5.
* **Legend:** Located in the bottom-right corner, the legend identifies the four data series:
* Red circles: Prime/AF
* Red triangles: Sub-Prime/AF
* Black circles: Prime/by-eye
* Black triangles: Sub-Prime/by-eye
* **Identity Line:** A dashed gray line runs diagonally across the plot, representing the line y = x.
### Detailed Analysis
**1. Prime/AF (Red Circles):**
* Trend: The data points are scattered above the identity line.
* Data Points:
* (-1.0, -0.6)
* (-0.7, -0.6)
* (-0.5, -0.2)
* (-1.2, -0.7)
* (-1.5, -0.4)
* (-2.0, -1.5)
**2. Sub-Prime/AF (Red Triangles):**
* Trend: The data points are scattered around the identity line.
* Data Points:
* (-1.5, -1.5)
* (-1.7, -1.0)
* (-1.0, -0.8)
* (-0.8, -0.6)
* (-2.0, -1.6)
* (-0.2, 0.5)
**3. Prime/by-eye (Black Circles):**
* Trend: The data points are clustered below the identity line.
* Data Points:
* (-2.5, -1.3)
* (-2.3, -1.3)
* (-1.3, -1.2)
* (-1.0, -1.0)
* (-0.5, -0.1)
* (0.2, 0.0)
**4. Sub-Prime/by-eye (Black Triangles):**
* Trend: The data points are clustered near the identity line at lower values.
* Data Points:
* (-2.3, -1.7)
* (-1.7, -1.6)
* (-1.5, -1.5)
* (-1.2, -1.0)
### Key Observations
* The "Prime/AF" data series (red circles) generally exhibits higher anomaly values compared to the other series for a given initial value.
* The "Prime/by-eye" data series (black circles) generally exhibits lower anomaly values compared to the other series for a given initial value.
* The "Sub-Prime/AF" (red triangles) and "Sub-Prime/by-eye" (black triangles) data series are more closely aligned with the identity line, especially at lower values of log|u_0|.
* There is a noticeable clustering of "Prime/by-eye" data points (black circles) at the lower end of the anomaly values.
### Interpretation
The scatter plot visualizes the relationship between initial values and anomalies under different experimental conditions (Prime/Sub-Prime and AF/by-eye). The position of the data points relative to the identity line (y=x) indicates whether the anomaly is greater than, equal to, or less than the initial value (in log scale).
The "Prime/AF" condition tends to produce higher anomalies compared to the initial values, suggesting a greater sensitivity or amplification of the initial state. Conversely, the "Prime/by-eye" condition tends to result in lower anomalies, indicating a dampening or stabilization effect. The "Sub-Prime" conditions, regardless of "AF" or "by-eye", appear to have a more balanced relationship between initial values and anomalies, especially at lower initial values.
The clustering of "Prime/by-eye" data points at lower anomaly values might indicate a stable or predictable behavior under these specific conditions. The spread of "Prime/AF" data points above the identity line suggests a more variable and potentially less predictable response.