## Scatter Plot: Relationship Between log|u0| and log|u_anom|
### Overview
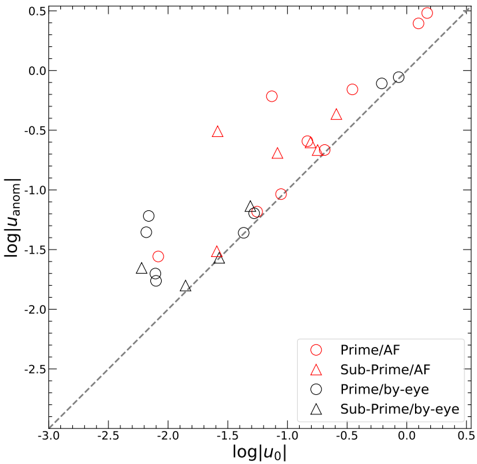
The image is a scatter plot comparing the logarithmic magnitudes of two variables: `log|u0|` (x-axis) and `log|u_anom|` (y-axis). Data points are categorized into four groups using distinct symbols and colors, with a dashed reference line (y = x) indicating parity between the two variables. The plot suggests a relationship between the baseline magnitude (`u0`) and anomalous magnitude (`u_anom`) across different classifications.
---
### Components/Axes
- **X-axis**: `log|u0|` (logarithmic scale), ranging from -3 to 0.
- **Y-axis**: `log|u_anom|` (logarithmic scale), ranging from -2.5 to 0.5.
- **Legend**: Located in the bottom-right corner, with four categories:
- **Red circles**: Prime/AF
- **Red triangles**: Sub-Prime/AF
- **Black circles**: Prime/by-eye
- **Black triangles**: Sub-Prime/by-eye
- **Dashed line**: y = x (45° reference line).
---
### Detailed Analysis
1. **Prime/AF (Red Circles)**:
- Data points cluster above the dashed line, indicating `log|u_anom| > log|u0|`.
- Example values:
- `log|u0| ≈ -2.5` → `log|u_anom| ≈ -1.5`
- `log|u0| ≈ -1.0` → `log|u_anom| ≈ -0.5`
- Trend: Positive correlation with a slight upward bias.
2. **Sub-Prime/AF (Red Triangles)**:
- Data points cluster below the dashed line, indicating `log|u_anom| < log|u0|`.
- Example values:
- `log|u0| ≈ -2.5` → `log|u_anom| ≈ -2.0`
- `log|u0| ≈ -1.5` → `log|u_anom| ≈ -1.5`
- Trend: Weak negative correlation.
3. **Prime/by-eye (Black Circles)**:
- Points are scattered around the dashed line, suggesting parity or weak correlation.
- Example values:
- `log|u0| ≈ -2.0` → `log|u_anom| ≈ -1.8`
- `log|u0| ≈ -1.0` → `log|u_anom| ≈ -1.2`
4. **Sub-Prime/by-eye (Black Triangles)**:
- Points are mostly below the dashed line, similar to Sub-Prime/AF but with less consistency.
- Example values:
- `log|u0| ≈ -2.5` → `log|u_anom| ≈ -2.2`
- `log|u0| ≈ -1.5` → `log|u_anom| ≈ -1.8`
---
### Key Observations
- **Prime/AF** consistently shows higher `log|u_anom|` than `log|u0|`, suggesting stronger anomalies in this category.
- **Sub-Prime/AF** and **Sub-Prime/by-eye** exhibit weaker anomalies, with `log|u_anom|` often lower than `log|u0|`.
- **Prime/by-eye** aligns closely with the parity line, indicating minimal deviation between `u0` and `u_anom`.
- The dashed line (y = x) acts as a baseline for comparing deviations across categories.
---
### Interpretation
The plot highlights distinct behavioral patterns between classifications:
1. **Prime/AF** likely represents high-impact anomalies, as its points deviate significantly above the parity line.
2. **Sub-Prime/AF** and **Sub-Prime/by-eye** may reflect lower-impact or less reliable anomalies, with deviations below the line.
3. **Prime/by-eye** suggests a more consistent or baseline relationship between `u0` and `u_anom`, possibly due to manual validation ("by-eye").
The AF (Automated Feature?) method introduces variability, with Prime/AF showing the strongest anomalies and Sub-Prime/AF the weakest. This could imply that automated feature extraction amplifies anomalies in Prime cases but underperforms in Sub-Prime scenarios. The "by-eye" method appears more balanced but less sensitive to extreme deviations.
No outliers are explicitly marked, but the spread of Sub-Prime/by-eye points suggests potential noise or measurement variability in that category.