## Flowchart: Online Decision Algorithm with Supervised Learning Integration
### Overview
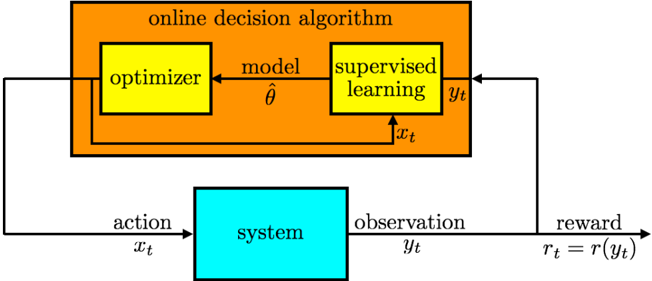
The diagram illustrates an online decision-making system where an optimizer interacts with a system through actions (x_t) and receives observations (y_t). A model with parameters θ is updated via supervised learning using observations, while the optimizer uses the model to make decisions. Rewards (r_t = r(y_t)) are calculated based on observations, creating a feedback loop for system improvement.
### Components/Axes
1. **Main Blocks**:
- **Orange Block**: "online decision algorithm" (central component)
- **Yellow Blocks**:
- "optimizer" (left)
- "supervised learning" (right)
- **Blue Block**: "system" (external environment)
2. **Data Flow**:
- **Inputs**:
- `x_t` (action) → system
- `θ` (model parameters) → optimizer
- **Outputs**:
- `y_t` (observation) → supervised learning
- `r_t = r(y_t)` (reward) → feedback loop
3. **Arrows**:
- Solid black arrows indicate data flow direction
- Dashed black arrow shows parameter update path (θ → model)
### Detailed Analysis
1. **Optimizer**:
- Receives model parameters `θ` (hat symbol indicates estimated/learned values)
- Makes decisions (`x_t`) based on current model state
2. **Supervised Learning**:
- Takes observations `y_t` as input
- Provides feedback to update model parameters `θ`
3. **System**:
- Processes actions `x_t`
- Generates observations `y_t`
- Calculates rewards `r_t` as a function of observations
4. **Reward Function**:
- Explicitly defined as `r_t = r(y_t)`
- Implies observation-dependent reward calculation
### Key Observations
1. **Feedback Loop**:
- Supervised learning output directly influences model parameters
- Creates continuous improvement mechanism for decision-making
2. **Temporal Dynamics**:
- Subscript `t` on all variables (`x_t`, `y_t`, `r_t`, `θ`) indicates time-series processing
3. **Color Coding**:
- Orange: Core algorithm components
- Yellow: Learning mechanisms
- Blue: External system interaction
4. **Parameter Estimation**:
- Model parameters `θ` are explicitly estimated (hat symbol)
### Interpretation
This architecture represents a hybrid reinforcement/supervised learning system where:
1. The optimizer acts as a policy network making real-time decisions
2. Supervised learning refines the model using observed outcomes
3. The reward function `r(y_t)` likely serves as the learning signal
4. The system-environment interaction follows a classic RL framework:
- Action → Observation → Reward
- Model updates via supervised learning on observations
5. The dashed arrow from supervised learning to model parameters suggests:
- Batch updates or periodic model refinement
- Contrast with solid arrows indicating real-time data flow
6. The absence of explicit exploration mechanisms (e.g., ε-greedy) suggests:
- Pure exploitation mode
- Or that exploration is handled externally
The diagram demonstrates a closed-loop system where decision-making and learning are tightly coupled through observation-based rewards and model parameter updates.