## Multi-Panel Line Chart: Model Performance vs. Training Data Size
### Overview
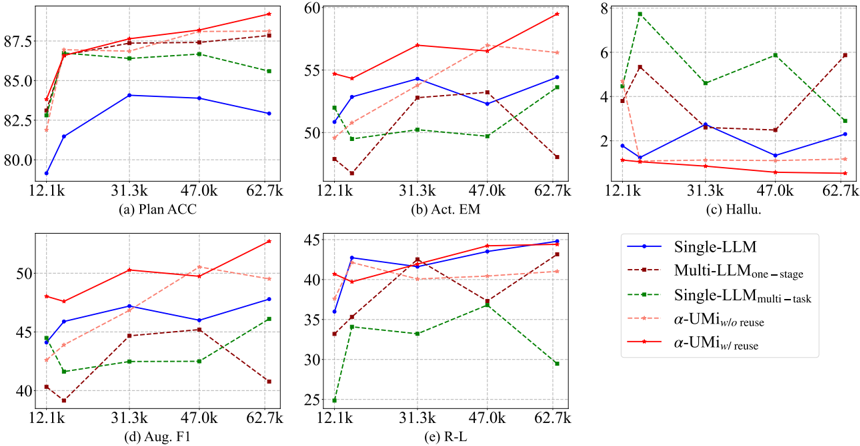
The image displays a set of five line charts arranged in a 2x3 grid (with the bottom-right space occupied by a legend). Each chart plots the performance of five different language model architectures against increasing training data sizes. The charts measure distinct evaluation metrics: Plan Accuracy (ACC), Action Exact Match (Act. EM), Hallucination rate (Hallu.), Augmented F1 score (Aug. F1), and ROUGE-L score (R-L).
### Components/Axes
* **Common X-Axis (All Charts):** Labeled with training data sizes: `12.1k`, `31.3k`, `47.0k`, `62.7k`. This represents the amount of training data used.
* **Y-Axes (Per Chart):**
* (a) Plan ACC: Range ~80.0 to ~88.0.
* (b) Act. EM: Range ~48 to ~60.
* (c) Hallu.: Range ~0 to ~8. Lower values are better.
* (d) Aug. F1: Range ~40 to ~53.
* (e) R-L: Range ~25 to ~45.
* **Legend (Bottom-Right Corner):** Identifies five model series:
1. `Single-LLM` (Blue solid line, circle markers)
2. `Multi-LLM_one-stage` (Brown dashed line, square markers)
3. `Single-LLM_multi-task` (Green dashed line, diamond markers)
4. `α-UMI_w/o reuse` (Light red/pink dashed line, triangle markers)
5. `α-UMI_w/ reuse` (Red solid line, star markers)
### Detailed Analysis
**Chart (a) Plan ACC:**
* **Trend:** All models show an increase in accuracy as training data grows from 12.1k to 31.3k, after which trends diverge.
* **Data Points (Approximate):**
* `α-UMI_w/ reuse` (Red): Starts ~83.0, rises to ~87.0, ends highest at ~88.5.
* `α-UMI_w/o reuse` (Pink): Follows a similar but slightly lower path than its counterpart, ending ~87.5.
* `Multi-LLM_one-stage` (Brown): Starts ~82.5, peaks at ~87.5, ends ~87.8.
* `Single-LLM_multi-task` (Green): Starts ~83.5, peaks at ~86.5, then declines to ~85.5.
* `Single-LLM` (Blue): Starts lowest at ~79.5, rises to ~84.0, then slightly declines to ~83.0.
**Chart (b) Act. EM:**
* **Trend:** Performance is more volatile. The `α-UMI_w/ reuse` model shows a strong upward trend.
* **Data Points (Approximate):**
* `α-UMI_w/ reuse` (Red): Starts ~54.5, dips slightly, then rises sharply to ~59.5.
* `α-UMI_w/o reuse` (Pink): Starts ~50.5, rises to ~56.5, then declines to ~56.0.
* `Single-LLM` (Blue): Fluctuates between ~52.0 and ~54.5.
* `Multi-LLM_one-stage` (Brown): Starts low ~48.5, peaks at ~53.0, then drops to ~48.0.
* `Single-LLM_multi-task` (Green): Fluctuates between ~49.5 and ~51.0, ends at ~53.5.
**Chart (c) Hallu. (Hallucination Rate):**
* **Trend:** Lower is better. The `α-UMI` models show consistently low and decreasing hallucination rates.
* **Data Points (Approximate):**
* `α-UMI_w/ reuse` (Red): Starts ~1.2, decreases steadily to ~0.5.
* `α-UMI_w/o reuse` (Pink): Starts ~1.8, decreases to ~1.0.
* `Single-LLM` (Blue): Fluctuates between ~1.5 and ~2.5.
* `Multi-LLM_one-stage` (Brown): Starts ~4.0, peaks at ~5.5, ends ~6.0.
* `Single-LLM_multi-task` (Green): Starts highest at ~4.5, spikes to ~7.8, then declines to ~3.0.
**Chart (d) Aug. F1:**
* **Trend:** General upward trend for most models, with `α-UMI_w/ reuse` leading.
* **Data Points (Approximate):**
* `α-UMI_w/ reuse` (Red): Starts ~48.0, rises to ~50.5, ends highest at ~53.0.
* `α-UMI_w/o reuse` (Pink): Follows closely below the red line, ending ~49.5.
* `Single-LLM` (Blue): Rises from ~44.0 to ~47.5.
* `Multi-LLM_one-stage` (Brown): Starts ~40.5, rises to ~45.0, then drops to ~41.0.
* `Single-LLM_multi-task` (Green): Starts ~44.5, dips, then rises to ~46.0.
**Chart (e) R-L (ROUGE-L):**
* **Trend:** Most models improve with more data. `Single-LLM` and `α-UMI` models perform strongly.
* **Data Points (Approximate):**
* `Single-LLM` (Blue): Starts ~36.0, rises sharply to ~42.5, ends highest at ~44.5.
* `α-UMI_w/ reuse` (Red): Starts ~39.5, rises steadily to ~44.0.
* `α-UMI_w/o reuse` (Pink): Starts ~34.0, rises to ~40.0, then plateaus.
* `Multi-LLM_one-stage` (Brown): Starts ~33.5, rises to ~42.0, then drops to ~37.0.
* `Single-LLM_multi-task` (Green): Starts lowest at ~25.0, rises to ~37.0, then drops sharply to ~29.5.
### Key Observations
1. **Consistent Leader:** The `α-UMI_w/ reuse` model (red line) is the top or near-top performer across all five metrics, showing robust and scalable performance.
2. **Hallucination Control:** Both `α-UMI` variants demonstrate significantly lower and more stable hallucination rates compared to the other three models, especially as data increases.
3. **Multi-Task Instability:** The `Single-LLM_multi-task` model (green) shows high volatility, particularly in Hallucination and R-L scores, where it exhibits sharp peaks and drops.
4. **Data Scaling Benefit:** Most models show clear performance gains when increasing training data from 12.1k to 31.3k. The benefit beyond 31.3k is model- and metric-dependent.
5. **Single-LLM Baseline:** The basic `Single-LLM` (blue) is often outperformed but shows strong, steady improvement in the R-L metric.
### Interpretation
This set of charts provides a comparative analysis of model architectures for a task likely involving planning and execution (given metrics like Plan ACC and Act. EM). The data suggests that the proposed `α-UMI` framework, particularly with reuse (`w/ reuse`), offers a superior balance of high accuracy, low hallucination, and strong generalization (as seen in F1 and R-L scores). Its consistent performance across metrics indicates it is a more reliable and scalable approach.
The volatility of the `Multi-LLM_one-stage` and `Single-LLM_multi-task` models suggests they may be less stable or more sensitive to the specific training data distribution. The fact that `α-UMI_w/ reuse` often outperforms its no-reuse counterpart (`w/o reuse`) implies that the reuse mechanism within the framework provides a tangible benefit, possibly through more efficient knowledge consolidation or reduced catastrophic forgetting.
Overall, the visualization argues for the effectiveness of the `α-UMI` architecture, highlighting its advantages in both performance and stability as the volume of training data increases.