## Line Graphs: Model Performance Across Metrics
### Overview
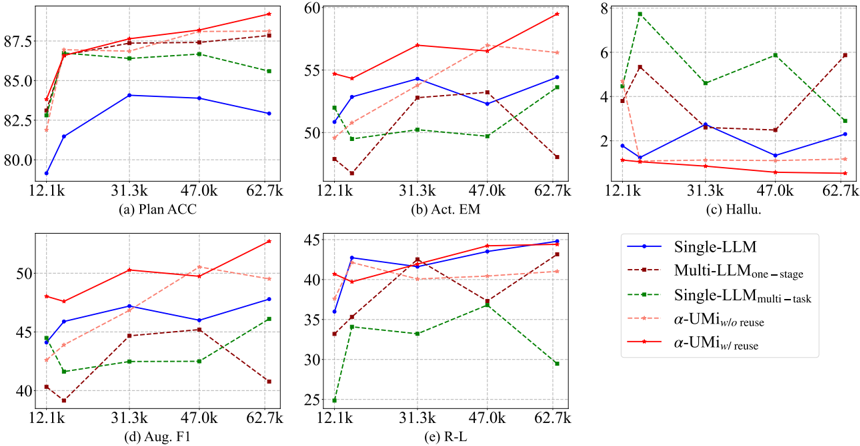
The image contains six line graphs (labeled a-f) comparing the performance of different language model configurations across five metrics: Plan ACC, Act EM, Hallu., Aug. F1, and R-L. Each graph plots performance against dataset size (x-axis: 12.1k–62.7k) with distinct colored lines representing model variants. The legend on the right maps colors to model types.
---
### Components/Axes
- **X-Axes**: Dataset size (12.1k, 31.3k, 47.0k, 62.7k) across all graphs.
- **Y-Axes**:
- (a) Plan ACC: 80–87.5
- (b) Act EM: 2–60
- (c) Hallu.: 2–8
- (d) Aug. F1: 25–50
- (e) R-L: 25–45
- **Legend** (right):
- Blue: Single-LLM
- Dark red: Multi-LLMone-stage
- Green: Single-LLMmulti-task
- Light pink: α-UMi w/o reuse
- Red: α-UMi w/ reuse
---
### Detailed Analysis
#### (a) Plan ACC
- **Trends**:
- Red (α-UMi w/ reuse) starts at ~85, peaks at 87.5 (47.0k), then drops to ~86.
- Blue (Single-LLM) starts at 80, rises to 82.5 (31.3k), then declines to 82.5.
- Green (Single-LLMmulti-task) fluctuates between 82.5–85.
- **Values**:
- At 12.1k: Red ~85, Blue ~80, Green ~82.5.
- At 62.7k: Red ~86, Blue ~82.5, Green ~85.
#### (b) Act EM
- **Trends**:
- Red (α-UMi w/ reuse) peaks at 57.5 (31.3k), then drops to ~55.
- Blue (Single-LLM) rises to 55 (31.3k), then declines to ~50.
- Dark red (Multi-LLMone-stage) fluctuates between 45–55.
- **Values**:
- At 12.1k: Red ~55, Blue ~50, Dark red ~45.
- At 62.7k: Red ~55, Blue ~50, Dark red ~40.
#### (c) Hallu.
- **Trends**:
- Green (Single-LLMmulti-task) starts at 6, drops to 4 (47.0k), then rises to 5.
- Red (α-UMi w/ reuse) peaks at 3 (31.3k), then drops to 2.
- Light pink (α-UMi w/o reuse) fluctuates between 2–4.
- **Values**:
- At 12.1k: Green ~6, Red ~2, Light pink ~3.
- At 62.7k: Green ~5, Red ~2, Light pink ~3.
#### (d) Aug. F1
- **Trends**:
- Red (α-UMi w/ reuse) peaks at 50 (31.3k), then drops to ~45.
- Blue (Single-LLM) rises to 45 (31.3k), then declines to ~42.5.
- Dark red (Multi-LLMone-stage) fluctuates between 35–45.
- **Values**:
- At 12.1k: Red ~45, Blue ~40, Dark red ~35.
- At 62.7k: Red ~45, Blue ~42.5, Dark red ~35.
#### (e) R-L
- **Trends**:
- Red (α-UMi w/ reuse) peaks at 45 (31.3k), then drops to ~40.
- Blue (Single-LLM) rises to 40 (31.3k), then declines to ~35.
- Green (Single-LLMmulti-task) fluctuates between 30–35.
- **Values**:
- At 12.1k: Red ~40, Blue ~35, Green ~30.
- At 62.7k: Red ~40, Blue ~35, Green ~25.
---
### Key Observations
1. **α-UMi w/ reuse** (red) consistently outperforms other models in Plan ACC, Aug. F1, and R-L.
2. **Single-LLMmulti-task** (green) shows the worst performance in Hallu. and R-L, with a sharp drop at 62.7k.
3. **Multi-LLMone-stage** (dark red) exhibits instability, particularly in Act EM (40 at 62.7k vs. 55 at 31.3k).
4. **α-UMi w/o reuse** (light pink) underperforms its "w/ reuse" counterpart across all metrics.
---
### Interpretation
- **Model Efficiency**: α-UMi w/ reuse demonstrates superior performance, suggesting reuse mechanisms enhance accuracy. Single-LLMmulti-task struggles with hallucination (Hallu.) and reasoning (R-L), indicating potential overfitting or task-specific limitations.
- **Dataset Size Impact**: Performance generally improves with larger datasets (e.g., Plan ACC peaks at 47.0k), but plateaus or declines at 62.7k, hinting at diminishing returns or data quality issues.
- **Outliers**: The green line in (c) Hallu. peaks at 6 (12.1k), suggesting initial overconfidence in smaller datasets. The dark red line in (b) Act EM drops sharply at 62.7k, possibly due to model instability at scale.
This analysis highlights trade-offs between model complexity, reuse strategies, and dataset size in language model performance.