\n
## Diagram: Hybrid Probabilistic-Classical Computing System
### Overview
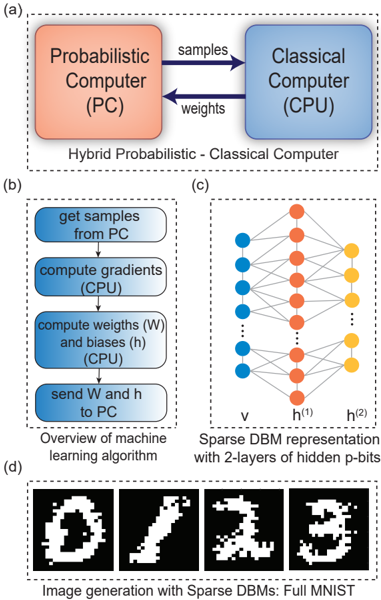
The image presents a diagram illustrating a hybrid computing system combining a Probabilistic Computer (PC) and a Classical Computer (CPU). It details the interaction between these two components, the machine learning algorithm overview, a sparse Deep Belief Machine (DBM) representation, and examples of image generation using the system. The image is divided into four sub-diagrams labeled (a), (b), (c), and (d).
### Components/Axes
* **(a) Hybrid Probabilistic-Classical Computer:** Shows the interaction between a "Probabilistic Computer (PC)" and a "Classical Computer (CPU)". The PC sends "samples" and "weights" to the CPU.
* **(b) Overview of Machine Learning Algorithm:** A flowchart outlining the steps of the machine learning algorithm.
* **(c) Sparse DBM Representation:** A diagram of a neural network structure with labeled layers.
* **(d) Image Generation with Sparse DBMs:** Displays four generated images of digits.
* **Labels in (c):** "v" (bottom layer), "h<sup>(1)</sup>" (middle layer), "h<sup>(2)</sup>" (top layer).
### Detailed Analysis or Content Details
**(a) Hybrid Probabilistic-Classical Computer:**
* The Probabilistic Computer (PC) is represented by a salmon-colored rectangle in the top-left.
* The Classical Computer (CPU) is represented by a light-blue rectangle in the top-right.
* An arrow labeled "samples" points from the PC to the CPU.
* An arrow labeled "weights" points from the PC to the CPU.
* Text below the rectangles reads: "Hybrid Probabilistic - Classical Computer".
**(b) Overview of Machine Learning Algorithm:**
* This section is a flowchart within a light-blue rectangle.
* Step 1: "get samples from PC" (top rectangle).
* Step 2: "compute gradients" (middle-top rectangle).
* Step 3: "compute weights (W) and biases (h) (CPU)" (middle-bottom rectangle).
* Step 4: "send W and h to PC" (bottom rectangle).
* Text below the flowchart reads: "Overview of machine learning algorithm".
**(c) Sparse DBM Representation:**
* This section depicts a neural network.
* The bottom layer ("v") consists of approximately 8 blue nodes.
* The middle layer ("h<sup>(1)</sup>") consists of approximately 6 orange nodes.
* The top layer ("h<sup>(2)</sup>") consists of approximately 6 orange nodes.
* Connections between layers are represented by dotted lines.
**(d) Image Generation with Sparse DBMs:**
* This section displays four generated images.
* Image 1: Digit "0".
* Image 2: Digit "7".
* Image 3: Digit "2".
* Image 4: Digit "3".
* Text below the images reads: "Image generation with Sparse DBMs: Full MNIST".
### Key Observations
* The system utilizes a hybrid approach, leveraging the strengths of both probabilistic and classical computing.
* The machine learning algorithm involves iterative sampling, gradient computation, and weight/bias updates.
* The DBM architecture consists of multiple layers of hidden units.
* The system is capable of generating images resembling handwritten digits from the MNIST dataset.
### Interpretation
The diagram illustrates a novel computing paradigm that combines the advantages of probabilistic and classical computation. The probabilistic computer likely generates samples, which are then used by the classical computer to compute gradients and update weights. This iterative process allows the system to learn and generate complex data, such as images of handwritten digits. The use of a sparse DBM suggests an attempt to reduce computational complexity and improve generalization performance. The MNIST dataset is a standard benchmark for image recognition and generation, indicating that the system is being evaluated on a well-established task. The overall architecture suggests a potential for developing more efficient and powerful machine learning algorithms. The flow of information is clearly defined, starting with the PC generating samples, moving to the CPU for processing, and then back to the PC with updated weights. This cyclical process is central to the machine learning algorithm. The diagram doesn't provide quantitative data, but rather a conceptual overview of the system's architecture and functionality.