## Line Chart: Correlation vs. Reasoning Steps
### Overview
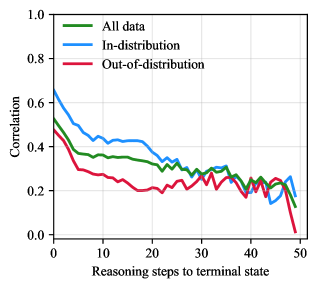
The image is a line chart that plots the correlation against the number of reasoning steps to a terminal state. There are three data series represented: "All data," "In-distribution," and "Out-of-distribution." The chart shows how the correlation changes as the number of reasoning steps increases for each of these categories.
### Components/Axes
* **X-axis:** Reasoning steps to terminal state (ranging from 0 to 50 in increments of 10).
* **Y-axis:** Correlation (ranging from 0.0 to 1.0 in increments of 0.2).
* **Legend:** Located in the top-left corner.
* **Green:** All data
* **Blue:** In-distribution
* **Red:** Out-of-distribution
### Detailed Analysis
* **All data (Green):**
* Trend: Starts high and generally decreases with some fluctuations.
* Approximate values:
* At 0 steps: ~0.5
* At 10 steps: ~0.36
* At 20 steps: ~0.36
* At 30 steps: ~0.3
* At 40 steps: ~0.25
* At 50 steps: ~0.1
* **In-distribution (Blue):**
* Trend: Starts high, decreases, fluctuates, and then decreases sharply at the end.
* Approximate values:
* At 0 steps: ~0.65
* At 10 steps: ~0.45
* At 20 steps: ~0.4
* At 30 steps: ~0.3
* At 40 steps: ~0.25
* At 50 steps: ~0.25
* **Out-of-distribution (Red):**
* Trend: Starts lower than the other two, decreases, and fluctuates.
* Approximate values:
* At 0 steps: ~0.5
* At 10 steps: ~0.3
* At 20 steps: ~0.25
* At 30 steps: ~0.25
* At 40 steps: ~0.2
* At 50 steps: ~0.0
### Key Observations
* The "In-distribution" data initially has the highest correlation, but it drops significantly towards the end.
* The "Out-of-distribution" data consistently has the lowest correlation throughout the range of reasoning steps.
* All three data series show a general decreasing trend in correlation as the number of reasoning steps increases.
### Interpretation
The chart suggests that as the number of reasoning steps increases, the correlation between the model's predictions and the ground truth decreases. This is particularly evident for "Out-of-distribution" data, indicating that the model's performance degrades more rapidly when dealing with data outside of its training distribution. The "In-distribution" data starts with a higher correlation, suggesting better initial performance, but its sharp decline at higher reasoning steps indicates that even for data within the training distribution, the model struggles with longer reasoning chains. The "All data" series represents an average performance across both in- and out-of-distribution data. The overall trend highlights the challenge of maintaining high correlation in complex reasoning tasks, especially when dealing with unfamiliar data.