\n
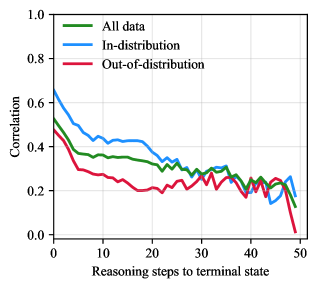
## Line Chart: Correlation vs. Reasoning Steps
### Overview
The image presents a line chart illustrating the correlation between reasoning steps to a terminal state and the correlation value for three different datasets: "All data", "In-distribution", and "Out-of-distribution". The chart displays how correlation changes as the number of reasoning steps increases.
### Components/Axes
* **X-axis:** "Reasoning steps to terminal state", ranging from 0 to 50.
* **Y-axis:** "Correlation", ranging from 0.0 to 1.0.
* **Legend:** Located at the top-center of the chart, identifying the three data series:
* Green Line: "All data"
* Blue Line: "In-distribution"
* Red Line: "Out-of-distribution"
* **Gridlines:** Present to aid in reading values.
### Detailed Analysis
Let's analyze each line individually, noting trends and approximate data points.
* **All data (Green Line):** The line starts at approximately 0.52 at step 0, generally slopes downward, with some fluctuations, reaching a minimum of around 0.22 at step 45, and ends at approximately 0.24 at step 50.
* **In-distribution (Blue Line):** This line begins at approximately 0.65 at step 0, exhibits a steeper downward slope than the "All data" line, reaching a minimum of around 0.20 at step 45, and ends at approximately 0.22 at step 50.
* **Out-of-distribution (Red Line):** Starting at approximately 0.45 at step 0, this line shows a consistent downward trend, with more pronounced fluctuations than the other two lines. It reaches a minimum of approximately 0.15 at step 45, and then drops sharply to approximately 0.08 at step 50.
### Key Observations
* All three lines demonstrate a decreasing correlation as the number of reasoning steps increases.
* The "In-distribution" data consistently exhibits the highest correlation values across all reasoning steps, followed by "All data", and then "Out-of-distribution".
* The "Out-of-distribution" data shows the most significant drop in correlation, particularly towards the end of the reasoning steps (between steps 40 and 50).
* The correlation values for all three datasets converge towards the lower end of the scale (around 0.2) as the number of reasoning steps approaches 50.
### Interpretation
The chart suggests that as the number of reasoning steps increases, the correlation between the reasoning process and the outcome decreases for all datasets. This could indicate that longer reasoning chains introduce more uncertainty or noise into the process. The higher correlation observed for "In-distribution" data suggests that the reasoning process is more reliable when dealing with familiar or expected scenarios. Conversely, the lower and rapidly decreasing correlation for "Out-of-distribution" data indicates that the reasoning process becomes less reliable when faced with unfamiliar or unexpected scenarios. The sharp drop in correlation for "Out-of-distribution" data at the later reasoning steps suggests that the model struggles to maintain coherence or accuracy as the reasoning chain becomes more extended in these unfamiliar contexts. This could be due to error propagation or the accumulation of incorrect assumptions. The convergence of all lines towards a low correlation value at step 50 suggests a potential limit to the effectiveness of the reasoning process, regardless of the data distribution, when the reasoning chain becomes sufficiently long.