## Line Graph: Correlation vs. Reasoning Steps to Terminal State
### Overview
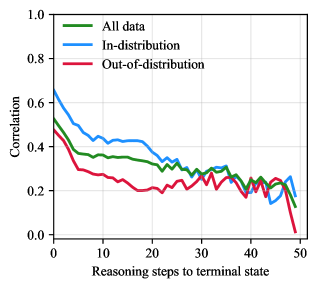
The image depicts a line graph comparing the correlation of three data categories ("All data," "In-distribution," and "Out-of-distribution") across 50 reasoning steps to a terminal state. All three lines exhibit a general downward trend, with convergence toward lower correlation values as reasoning steps increase.
### Components/Axes
- **Y-axis**: "Correlation" (scale: 0.0 to 1.0, linear increments).
- **X-axis**: "Reasoning steps to terminal state" (scale: 0 to 50, linear increments).
- **Legend**: Located in the top-right corner, with three entries:
- Green: "All data"
- Blue: "In-distribution"
- Red: "Out-of-distribution"
### Detailed Analysis
1. **All data (Green)**:
- Starts at ~0.6 correlation at x=0.
- Gradually declines to ~0.2 by x=50.
- Shows minor fluctuations but maintains a steady downward slope.
2. **In-distribution (Blue)**:
- Begins at ~0.8 correlation at x=0.
- Drops sharply to ~0.4 by x=10, then stabilizes around ~0.3–0.4 until x=30.
- Declines further to ~0.2 by x=50.
3. **Out-of-distribution (Red)**:
- Starts at ~0.4 correlation at x=0.
- Declines steadily to ~0.2 by x=30, with minor oscillations.
- Remains flat at ~0.2 from x=30 to x=50.
### Key Observations
- All three lines converge to a correlation of ~0.2 by x=50, suggesting diminishing performance across all data types at longer reasoning steps.
- "In-distribution" data begins with the highest correlation but experiences the steepest initial decline.
- "Out-of-distribution" data starts with the lowest correlation but follows a similar long-term trend.
- No significant outliers or anomalies are observed; all lines exhibit smooth, continuous trends.
### Interpretation
The graph demonstrates that increased reasoning steps correlate with reduced performance across all data categories. The "In-distribution" data initially outperforms others but degrades more rapidly, while "Out-of-distribution" data maintains a consistently lower baseline. This suggests that longer reasoning chains may disproportionately impact in-distribution data, potentially due to overfitting or complexity mismatches. The convergence at x=50 implies that extended reasoning steps homogenize performance across data types, possibly due to shared failure modes or saturation effects.