## Line Chart: Execution Time vs. Input Size
### Overview
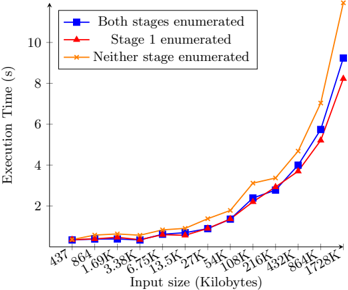
The image is a line chart comparing the execution time (in seconds) against the input size (in Kilobytes) for three different scenarios: "Both stages enumerated", "Stage 1 enumerated", and "Neither stage enumerated". The chart shows how execution time increases with input size for each scenario.
### Components/Axes
* **X-axis:** Input size (Kilobytes). The axis markers are: 437, 864, 1.69K, 3.38K, 6.75K, 13.5K, 27K, 54K, 108K, 216K, 432K, 864K, 1728K.
* **Y-axis:** Execution Time (s). The axis markers are: 2, 4, 6, 8, 10.
* **Legend:** Located at the top-left of the chart.
* Blue square: Both stages enumerated
* Red triangle: Stage 1 enumerated
* Orange cross: Neither stage enumerated
### Detailed Analysis
* **Both stages enumerated (Blue Square):** The line starts relatively flat, then begins to increase more rapidly after 216K.
* 437: ~0.3
* 864: ~0.3
* 1.69K: ~0.2
* 3.38K: ~0.2
* 6.75K: ~0.2
* 13.5K: ~0.3
* 27K: ~0.5
* 54K: ~0.9
* 108K: ~1.3
* 216K: ~2.4
* 432K: ~3.2
* 864K: ~5.4
* 1728K: ~9.2
* **Stage 1 enumerated (Red Triangle):** The line follows a similar trend to "Both stages enumerated", but generally has slightly lower execution times.
* 437: ~0.3
* 864: ~0.2
* 1.69K: ~0.1
* 3.38K: ~0.1
* 6.75K: ~0.1
* 13.5K: ~0.2
* 27K: ~0.4
* 54K: ~0.8
* 108K: ~1.2
* 216K: ~2.3
* 432K: ~2.9
* 864K: ~5.1
* 1728K: ~8.2
* **Neither stage enumerated (Orange Cross):** The line also increases with input size, and has the highest execution time at larger input sizes.
* 437: ~0.4
* 864: ~0.4
* 1.69K: ~0.5
* 3.38K: ~0.6
* 6.75K: ~0.7
* 13.5K: ~0.8
* 27K: ~1.0
* 54K: ~1.4
* 108K: ~1.8
* 216K: ~2.5
* 432K: ~3.4
* 864K: ~4.8
* 1728K: ~11.0
### Key Observations
* All three scenarios show an increase in execution time as the input size increases.
* At smaller input sizes (below 216K), the execution times for all three scenarios are relatively close.
* At larger input sizes (above 216K), the execution times diverge, with "Neither stage enumerated" having the highest execution time, followed by "Both stages enumerated", and then "Stage 1 enumerated".
* The increase in execution time is more pronounced for "Neither stage enumerated" at larger input sizes.
### Interpretation
The data suggests that enumerating at least one stage is beneficial for performance, especially as the input size grows. Enumerating both stages provides a slight performance advantage over enumerating only stage 1. Not enumerating any stage results in the worst performance, with a significant increase in execution time as the input size increases. This indicates that enumeration helps optimize the process, reducing the time required to handle larger inputs. The performance difference becomes more significant as the input size increases, highlighting the importance of enumeration for scalability.