## Line Graph: Execution Time vs. Input Size
### Overview
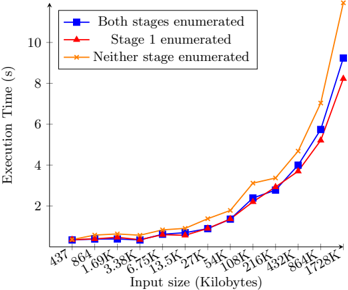
The image is a line graph comparing execution time (in seconds) across three scenarios as input size increases from 437KB to 1728KB. The three scenarios are:
1. **Both stages enumerated** (blue squares)
2. **Stage 1 enumerated** (red triangles)
3. **Neither stage enumerated** (orange crosses)
### Components/Axes
- **X-axis (Input size)**: Labeled "Input size (Kilobytes)" with values: 437, 864, 1.69K, 3.38K, 6.75K, 13.5K, 27K, 54K, 108K, 216K, 432K, 864K, 1728K.
- **Y-axis (Execution Time)**: Labeled "Execution Time (s)" with a scale from 0 to 10.
- **Legend**: Positioned in the top-right corner, with three entries:
- Blue squares: "Both stages enumerated"
- Red triangles: "Stage 1 enumerated"
- Orange crosses: "Neither stage enumerated"
### Detailed Analysis
1. **Both stages enumerated (blue squares)**:
- Starts at ~0.5s for 437KB.
- Gradual increase to ~0.8s at 1.69K.
- Accelerates sharply after 864K, reaching ~9s at 1728K.
2. **Stage 1 enumerated (red triangles)**:
- Starts at ~0.5s for 437KB.
- Slightly lower than blue line at all points (e.g., ~0.7s at 864K).
- Reaches ~8s at 1728K.
3. **Neither stage enumerated (orange crosses)**:
- Starts at ~0.5s for 437KB.
- Gradual rise to ~3s at 108K.
- Steep increase after 864K, peaking at ~10s at 1728K.
### Key Observations
- All three scenarios show increasing execution time with larger input sizes.
- **Both stages enumerated** (blue) and **Stage 1 enumerated** (red) exhibit similar trends, with blue consistently slightly higher.
- **Neither stage enumerated** (orange) diverges significantly at larger inputs, showing the steepest rise after 864K.
- At 1728K, execution times are:
- Blue: ~9s
- Red: ~8s
- Orange: ~10s
### Interpretation
The data suggests that enumerating both stages (blue) is the most efficient approach, while enumerating only Stage 1 (red) offers marginal improvements. **Not enumerating either stage** (orange) leads to significantly worse performance, particularly at larger input sizes. The sharp rise in the orange line after 864K indicates that skipping enumeration becomes increasingly costly as data grows. This highlights the importance of enumeration strategies in optimizing execution time for large datasets.