# Technical Data Extraction: Relative Expert Load Heatmaps
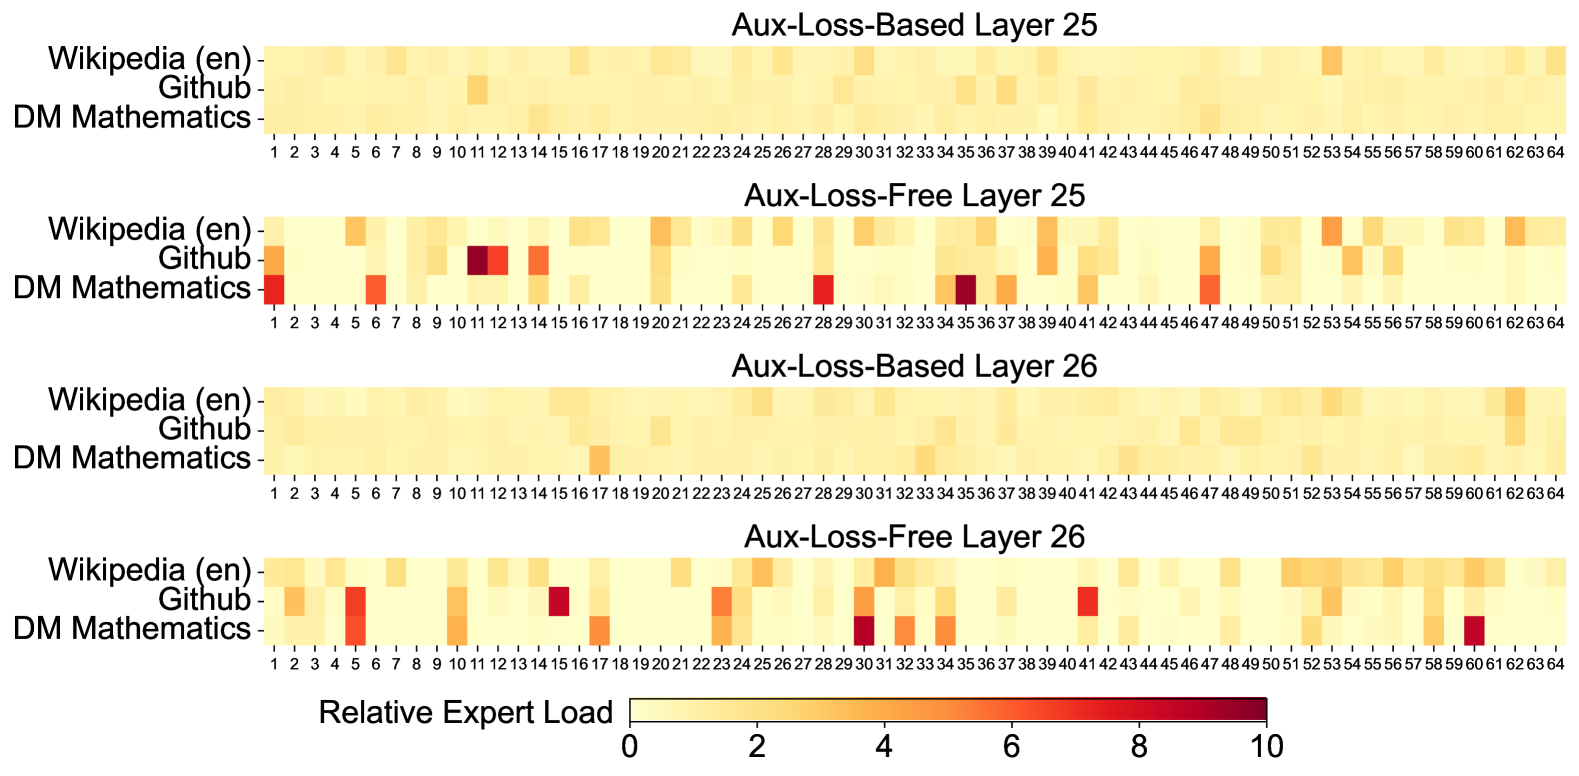
This document provides a detailed extraction and analysis of the provided image, which contains four heatmaps illustrating "Relative Expert Load" across different model layers and training configurations.
## 1. Document Overview
The image consists of four vertically stacked heatmaps comparing two training methodologies (**Aux-Loss-Based** vs. **Aux-Loss-Free**) across two specific model layers (**Layer 25** and **Layer 26**).
### Global Components
* **X-Axis (All Charts):** Expert Index, ranging from **1 to 64**.
* **Y-Axis (All Charts):** Data Domains:
1. Wikipedia (en)
2. Github
3. DM Mathematics
* **Legend (Bottom Center):**
* **Title:** Relative Expert Load
* **Scale:** Linear gradient from 0 to 10.
* **Color Mapping:**
* Light Yellow: 0 (Low Load)
* Orange: ~5 (Medium Load)
* Dark Red/Maroon: 10 (High Load)
---
## 2. Heatmap Analysis by Region
### Region 1: Aux-Loss-Based Layer 25
* **Trend:** This chart shows a highly uniform distribution. The colors are almost exclusively light yellow, indicating that the load is balanced evenly across all 64 experts for all three domains.
* **Key Observations:**
* Slightly darker yellow/orange tint at Expert 53 for Wikipedia (en).
* Overall, no significant "specialization" or "hotspots" are visible.
### Region 2: Aux-Loss-Free Layer 25
* **Trend:** This chart shows high variance and significant expert specialization. Certain experts are heavily utilized by specific domains while others are ignored.
* **High Load Data Points (Hotspots):**
* **Wikipedia (en):** Moderate load at Expert 6, 20, 53, and 62.
* **Github:** High load (Dark Red) at Expert 11 and 12. Moderate load at Expert 1, 14, 20, 39, and 47.
* **DM Mathematics:** High load (Dark Red) at Expert 1, 35, and 47. Moderate load at Expert 6, 28, 37, and 41.
### Region 3: Aux-Loss-Based Layer 26
* **Trend:** Similar to Layer 25 (Aux-Loss-Based), this shows a very uniform, low-intensity distribution across all experts.
* **Key Observations:**
* Slightly higher load at Expert 17 for DM Mathematics.
* Slightly higher load at Expert 62 for Wikipedia (en).
* The "Aux-Loss-Based" method consistently results in a "smeared" load where no single expert carries a heavy burden.
### Region 4: Aux-Loss-Free Layer 26
* **Trend:** Like its Layer 25 counterpart, this shows distinct specialization and high-intensity hotspots, though the specific experts utilized have shifted.
* **High Load Data Points (Hotspots):**
* **Wikipedia (en):** Moderate load distributed across Experts 51-60.
* **Github:** High load at Expert 15 and 41. Moderate load at Expert 1, 5, 10, 23, 29, 32, and 53.
* **DM Mathematics:** High load (Dark Red) at Expert 30 and 60. Moderate load at Expert 5, 17, 23, 32, and 34.
---
## 3. Comparative Summary
| Feature | Aux-Loss-Based (Layers 25 & 26) | Aux-Loss-Free (Layers 25 & 26) |
| :--- | :--- | :--- |
| **Load Distribution** | Uniform / Balanced | Sparse / Specialized |
| **Peak Intensity** | Low (mostly < 2) | High (reaching 8-10) |
| **Domain Separation** | Low; domains use all experts similarly. | High; specific experts "belong" to specific domains. |
| **Visual Pattern** | Consistent light yellow wash. | Distinct orange and red blocks against yellow. |
## 4. Technical Conclusion
The data indicates that the **Aux-Loss-Based** training mechanism enforces a load-balancing constraint that prevents expert specialization, resulting in a near-even distribution of work across the 64 experts. Conversely, the **Aux-Loss-Free** approach allows the model to naturally gravitate toward expert specialization, where specific experts become highly activated for specific types of data (e.g., Github or Mathematics), leading to much higher "Relative Expert Load" values on a subset of the available experts.