# Technical Document Extraction: Heatmap Analysis
## Image Description
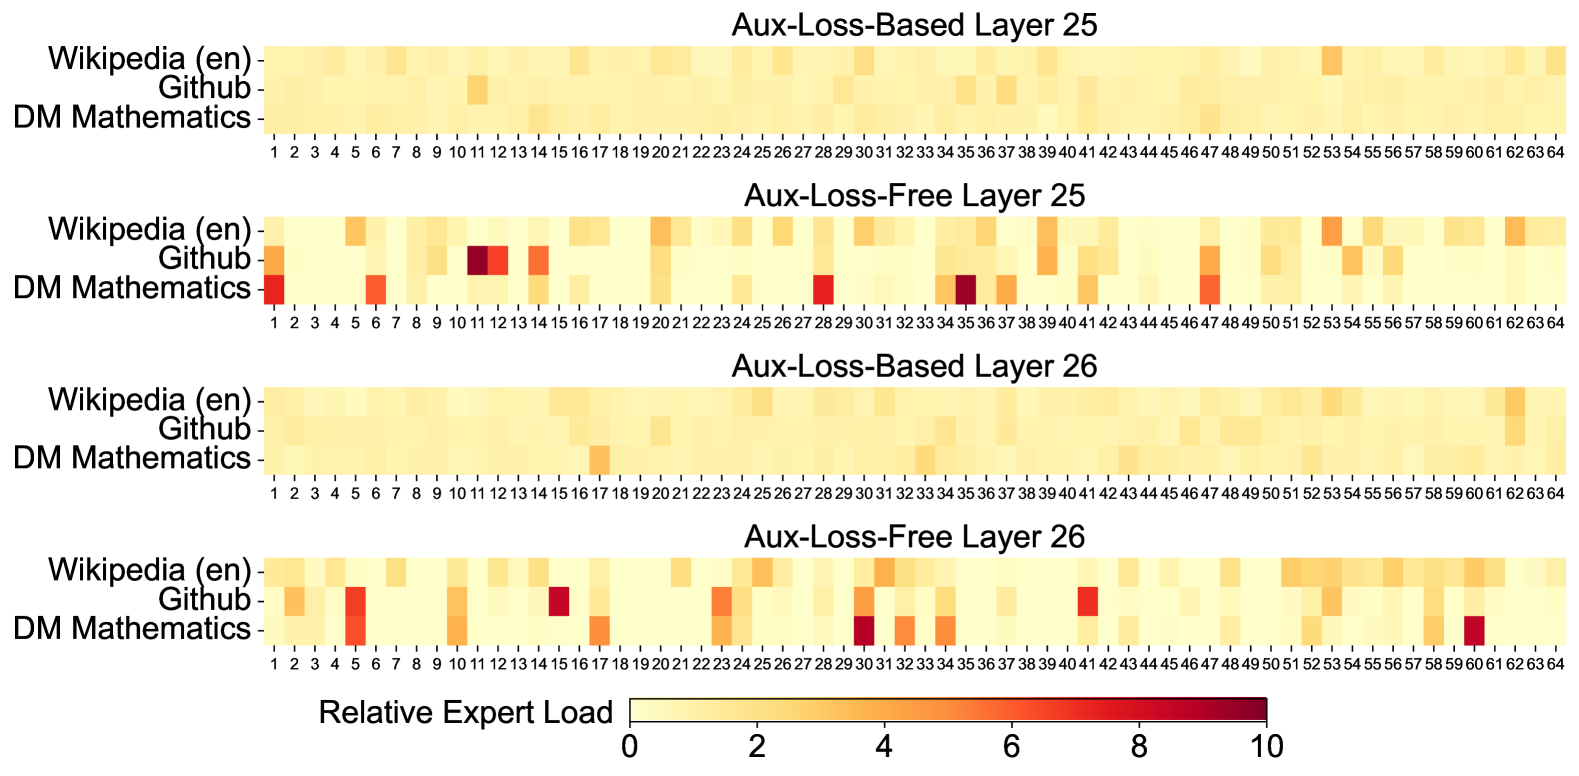
The image presents a comparative heatmap analysis across four neural network layers (25 and 26) with two configurations (Aux-Loss-Based and Aux-Loss-Free). The heatmaps visualize "Relative Expert Load" across three data sources: Wikipedia (en), Github, and DM Mathematics. Color intensity represents load magnitude, with a legend scale from 0 (light yellow) to 10 (dark red).
---
## Key Components
### Legend
- **Title**: Relative Expert Load
- **Color Scale**:
- Light yellow → 0
- Dark red → 10
- **Placement**: Bottom of the image
### Axes
- **X-Axis**:
- Label: Relative Expert Load
- Markers: Integer values 1–64 (discrete intervals)
- **Y-Axis**:
- Categories:
1. Wikipedia (en)
2. Github
3. DM Mathematics
- Layer Labels:
- Aux-Loss-Based Layer 25
- Aux-Loss-Free Layer 25
- Aux-Loss-Based Layer 26
- Aux-Loss-Free Layer 26
---
## Data Categories & Sub-Categories
1. **Layers**:
- Aux-Loss-Based Layer 25
- Aux-Loss-Free Layer 25
- Aux-Loss-Based Layer 26
- Aux-Loss-Free Layer 26
2. **Data Sources**:
- Wikipedia (en)
- Github
- DM Mathematics
---
## Data Points & Trends
### Aux-Loss-Based Layer 25
- **Wikipedia (en)**: Uniform light yellow (values ~0–2)
- **Github**: Light yellow (values ~0–2)
- **DM Mathematics**: Light yellow (values ~0–2)
### Aux-Loss-Free Layer 25
- **Wikipedia (en)**:
- Dark red square at x=11 (value ~10)
- Light yellow elsewhere (values ~0–2)
- **Github**:
- Dark red square at x=11 (value ~10)
- Light yellow elsewhere (values ~0–2)
- **DM Mathematics**:
- Dark red square at x=11 (value ~10)
- Light yellow elsewhere (values ~0–2)
### Aux-Loss-Based Layer 26
- **Wikipedia (en)**: Uniform light yellow (values ~0–2)
- **Github**: Light yellow (values ~0–2)
- **DM Mathematics**: Light yellow (values ~0–2)
### Aux-Loss-Free Layer 26
- **Wikipedia (en)**:
- Dark red square at x=15 (value ~10)
- Dark red square at x=41 (value ~10)
- Light yellow elsewhere (values ~0–2)
- **Github**:
- Dark red square at x=15 (value ~10)
- Dark red square at x=41 (value ~10)
- Light yellow elsewhere (values ~0–2)
- **DM Mathematics**:
- Dark red square at x=61 (value ~10)
- Light yellow elsewhere (values ~0–2)
---
## Spatial Grounding & Verification
- **Legend Position**: [x=0, y=bottom] (aligned with x-axis)
- **Color Consistency Check**:
- All dark red squares correspond to values ~10 (matches legend).
- Light yellow squares correspond to values ~0–2 (matches legend).
## Component Isolation
### Header
- Title: "Aux-Loss-Based Layer 25" (topmost heatmap)
### Main Chart
- Four heatmaps stacked vertically, each representing a layer configuration.
### Footer
- Legend and x-axis labels.
---
## Conclusion
The heatmaps reveal that **Aux-Loss-Free Layer 25** exhibits significantly higher relative expert load for **Github** and **DM Mathematics** at specific x-axis positions (x=11). Similarly, **Aux-Loss-Free Layer 26** shows elevated loads for **Wikipedia (en)** and **Github** at x=15 and x=41, and for **DM Mathematics** at x=61. All other data points across layers remain consistently low (0–2).